Inventory is a common accounting term used to describe items in various stages of preparation for sale. To create a successful business, you need to have a clear idea of how much you will sell before the next delivery.
For example, if you sell 250 pairs of shoes a week and a new shipment occurs every Friday, you would ideally order 250 pairs to keep up with demand. However, if demand increases or decreases between deliveries, you may have trouble maintaining the required inventory levels.
Types of inventory (TK)
In considering this concept, we can accurately say that technical specifications can be divided into the following categories:
- Finished products
(which may be sold).
- Unfinished production
or goods in the process of production.
- Raw materials
(to produce more finished products).
Inventory turnover ratio. Calculation using the example of OJSC ALROSA
Let's look at the inventory turnover ratio . This coefficient is part of the group of indicators of the business activity of the enterprise (Turnover).
The coefficients from this group show the intensity (turnover rate) of the use of assets or liabilities. With their help, you can find out how actively the company conducts its activities. Hence the second name of the group – Business Activity.
In foreign literary sources, this coefficient is called Inventory turnover.
Inventory turnover ratio. Economic sense
The coefficient shows the efficiency of inventory management at the enterprise. It determines how many times during the analyzed period the company used its reserves. In other words, the ratio shows the rate at which inventory is produced and released from the company's warehouse. This is an indicator of the effectiveness of the purchasing department (warehouse) and sales department.
Inventory turnover ratio analysis
How to analyze the value of this coefficient? If the value decreases (▼), it indicates that:
- the company accumulates excess inventory,
- The company has poor sales.
If the coefficient value increases (▲), then this indicates that:
- the company's inventory turnover increases,
- sales increase.
High values of this coefficient are also undesirable for an enterprise, since this is often associated with a constant shortage of goods in warehouses, which leads to customer losses and interruptions in the production process. It is necessary to find the golden line for each enterprise.
Inventory turnover ratio and its synonyms
The coefficient has synonyms that are often found in economic literature. To avoid any difficulties in interpreting the ratios, below are synonyms for the inventory turnover ratio:
- Inventory turnover ratio,
- Inventory turnover,
- Inventory turnover,
- Inventory turnover ratio,
- Material turnover ratio,
- Inventory turnover ratio,
Inventory turnover ratio. Calculation formula for balance sheet and IFRS
The formula for calculating the inventory turnover ratio is as follows:
Inventory Turnover Ratio = Sales Revenue/Average Inventory
Instead of Sales Revenue, Cost of Products Sold is sometimes used.
To calculate the coefficient, it is enough to have public reporting of the enterprise. According to RAS, the calculation formula is as follows:
Inventory turnover ratio = line 2110/(line 1210np.+line 1210kp.)*0.5
Np. – line value 1210 at the beginning of the period. Kp. – line value 1210 at the end of the period.
Remember to divide the sum of the beginning and ending inventories by 2 to find the company's average inventory.
The reporting period may not be a year, but, for example, a month or a quarter.
According to the old accounting form, the calculation formula will be as follows:
Inventory turnover ratio = line 10/(line 210np.+line 210kp.)*0.5
Sometimes, as mentioned above, instead of Revenue (p. 10), Cost of Products Sold (p. 20) is used.
Transformation of inventory turnover ratio into inventory turnover
Along with the coefficient, the indicator Inventory turnover (inventory turnover period) is used. It reflects the number of days required to convert reserves into money supply. The formula for transforming the inventory turnover ratio during the inventory turnover period is as follows:
Inventory Turnover (in days) = 360/Inventory Turnover Ratio
Sometimes the formula uses 365 instead of 360 days. The economic meaning of inventory turnover is that it determines how many days the company will have enough inventory in its warehouse.
Two approaches to calculating the inventory turnover ratio according to IFRS
There are two approaches to calculating the coefficient according to IFRS (International Financial Reporting System): in the first approach, the formula takes into account Revenue, and in the second, Cost of Products Sold. As you most likely noticed, in Russian practice there are also these two approaches to calculating the coefficient.
I will present everything in the form of a comparative table.
| 1 approach to calculating Goats | 2nd approach to calculating Goats |
| Inventory turnover = Sales/Inventory | Inventory turnovers=Cost of goods sold/Average Inventory |
| In this approach, Sales – Revenue, Inventories – inventories at the end of the reporting period | Cost of goods sold - cost of goods sold, Average Inventory - average value of inventories for the reporting period (sum at the beginning and end / 2) |
The discrepancy in results between these two approaches will be significant. This is due to the fact that Revenue significantly exceeds the Cost of Products Sold.
Working capital cycle (cash conversion cycle)
Inventory turnover is closely related to the working capital cycle . What is the money cycle? This is the number of days that pass from the moment of purchasing raw materials for production with cash until the moment of sale of manufactured goods. The working capital cycle (cash cycle) is measured in days and determines the efficiency of working capital management of an enterprise.
Formula for calculating the working capital cycle:
Working capital cycle (cash cycle) = Inventory turnover (in days) + Accounts receivable turnover (in days) – Accounts payable turnover (in days)
The shorter the cycle, the faster the company returns money from circulation. There is no optimal cycle value; it all depends on industry specifics.
Inventory turnover ratio. Calculation using the example of OJSC ALROSA
| It's time to look at an example. Let's consider calculating the inventory turnover ratio for OJSC ALROSA, which is the largest diamond mining enterprise. |
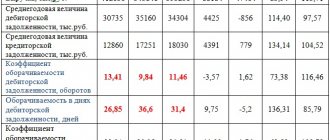
Calculation of the inventory turnover ratio for OJSC ALROSA. Balance
Calculation of the inventory turnover ratio for OJSC ALROSA. Financial results
Data on the balance sheet of OJSC ALROSA are taken from the official website of the company. Let's calculate the inventory turnover ratio for the year. Let's take 4 periods of 3.4 for 2013 and 1.2 for 2014. This will cover one calendar year.
Calculation of inventory turnover ratios for OJSC ALROSA:
Inventory turnover ratio 2013-4 = 138224744/(43416382+39598628)*0.5 = 3.3 Inventory turnover ratio 2014-1 =41503568/(39598628+37639412)*0.5 = 1 Inventory turnover ratio 2014-2 =81551030 /(37639412+41581870)*0.5 = 2
The values of the inventory turnover ratio for OJSC ALROSA are not constant, and there is no clear tendency towards growth or decline. For a more detailed analysis, it is advisable to determine the average value of the coefficient for the industry.
Inventory turnover ratio. Standard
The coefficient does not have a specific standard value. Each industry will have its own average ratio. The coefficient analysis can be carried out as follows:
- Dynamic analysis. Calculate the coefficient values for our enterprise for several periods and construct a time series of its changes. This will allow you to determine the trend of its change.
- Comparative analysis . Calculate the average value of the coefficient for the industry, and also identify the leader enterprise by the coefficient. This will make it possible to determine our place in comparison with enterprises in the industry as a whole.
Summary
Let us summarize the analysis of the inventory turnover ratio. It shows the intensity of use of inventories by the enterprise. The higher this coefficient, the more efficiently the enterprise operates
Source: https://finzz.ru/koefficient-oborachivaemosti-zapasov-inventory-turnover-raschet-na-primere-oao-alrosa.html
Inventory management
Given the significant costs and benefits associated with inventory, companies spend a significant amount of time and resources calculating what the level of reserves should be at any given time.
There are two possible options:
- An increase in TOR may indicate that the firm is not selling effectively, is expecting an increase in sales in the near future (for example, during the holidays), or has an ineffective purchasing department.
- A reduction in terms of reference may signal that a company is selling more than it expected, is experiencing difficulties with its supply chain, expects sales to decline, or is becoming more efficient in planning its purchasing activities.
For optimal management of technical requirements of an enterprise, they create standards that specify their minimum and maximum levels.
Excessive material assets include raw materials, materials, products, equipment and other material assets available to enterprises in quantities exceeding the calculated standard.
Product turnover. How and why to count it
The concept of product turnover determines how quickly the funds invested in goods will come back to you, and even with a profit. This is one of the main formulas for the company's success. In this article we will look at how to calculate it.
It is more convenient for analysts to look at the goods accounting service. MyWarehouse has built-in reports on turnover, balances, profitability, and movement of goods. You don't need to count anything yourself.
Just fill in the product information and record receipts, shipments, and sales. Reports are generated automatically and can be viewed at any time - for example, in the convenient MySklad mobile application.
Register and try it now: it's free!
The concepts that we will need to determine the turnover of goods:
Product
- a product produced for exchange. That is, to put it simply, the product could be a carton of milk, or it could be a model haircut or the services of a lawyer. In general, everything that can be bought with money or exchanged for something. We will talk about physical goods, not services.
Inventory
- these are company assets that differ from inventories in that goods and materials are intended for sale, that is, they are already available in physical form in the company’s warehouse or store.
At the same time, the inventory
- this is a slightly different concept: inventory includes, for example, goods that have already been sold but not yet shipped, or vice versa - goods that you have already paid for, but which have not yet been delivered to your warehouse. We are only interested in what is physically in the warehouse now.
Trade turnover
is the sum of the costs of all goods/services sold for a certain period. Simply put, how much did you sell goods for, for example, per month or per year. Trade turnover is calculated in purchase prices or in cost prices. We will base our calculations on purchase prices.
The last concept we will deal with when calculating product turnover is average inventory
. It is calculated using a simple formula: balances at the beginning of the period + balances at the end of the period/2.
There is another, more complex, version of the same formula (let us assume that we divide the entire calculation period into equal periods of time - months): we divide the inventory in half at the purchase price at the beginning of the calculation period (T1: 2), sequentially add the amount of stocks of each month, the last month's supply is also divided in half. Thus, the following is obtained: T1:2+T2+T3+T4+…T12:2. We divide this amount by the number of time periods (months) minus one. That is: T1:2+T2+T3+T4+T5+T6+T7+T8+T9+T10+T11+T12:2/12-1
Do not be surprised if the results obtained from calculations using a simplified method and a more complex one differ.
Which of the two results you accept as true depends on what you want to get by calculating product turnover using the formula.
Indicators
Indicators of the enterprise's technical specifications can be divided into two categories - absolute and relative.
Absolute indicators
They provide comprehensive information on each case for a particular enterprise and position. These include both material and financial units.
These indicators have their drawbacks. Using absolute indicators, it is impossible to correlate the amount of cash reserves to turnover
, and, therefore, calculate the production rate to accurately meet demand without overproduction.
Relative indicators
They solve the above problem and allow their level to be correlated with turnover. Such indicators allow you to understand how much reserves are needed to meet demand and replenish stocks without overloading warehouse space.
Turnover
This is the period of time during which the company sells its inventory in the amount of its average value. This information is useful in determining how well a company is managing its assets and liabilities.
In the balance sheet, current assets are the most liquid asset of an enterprise. Their economic essence lies in ensuring the reproductive process. If a business can increase its turnover, then, in theory, it can generate greater bottom line profits.
The inventory turnover ratio is calculated as the ratio of the cost of goods sold to the average inventory:
IT = Srp / Tzsr,
where Срп – cost of goods sold;
TZsr – average inventory.
Turnover and attrition
It is important not to confuse the two concepts – turnover and attrition.
Turnover is the number of product turnovers during a period.
Attrition rate is an indicator that tells how many days it takes for a product to leave the warehouse. If when calculating we do not operate with the average technical specifications, but calculate the turnover of one batch, then in reality we are talking about attrition rate.
Example:
On March 1, a batch of 1000 pencils arrived at the warehouse. On March 31, there were no pencils left in stock (0). Sales are equal to 1000 units. It seems that the turnover is equal to 1, that is, this stock turns over once a month. But it is necessary to understand that in this case we are talking about one batch and the time of its implementation. One batch doesn’t turn around in a month, it “goes away.”
If we calculate using the average stock, it turns out that on average there were 500 pieces in the warehouse per month.
1000/((1000 + 0)/2) = 2, that is, it turns out that the average inventory turnover (500 pcs.) will be equal to two periods. That is, if we brought two batches of pencils of 500 pieces each, then each batch would be sold in 15 days. In this case, it is incorrect to calculate turnover, because we are talking about one batch and do not take into account the period when pencils were sold to zero balance - perhaps this happened in the middle of the month.
To calculate the inventory turnover ratio, batch accounting is not needed. There is an inflow of goods and an outflow of goods. Given a period (for example, 1 month), we can calculate the average inventory for the period and divide the sales volume by it.
Turnover rate
Very often you can hear the question: “What turnover rates exist? Which is correct?
The turnover ratio does not have recommended values. There is only one rule: the higher it is, the less time the goods are in the warehouse, the faster they turn into money.
But companies always have the concept of “TURN OVER RATE” and each company has its own concept.
The turnover rate is the number of days (or revolutions) for which, in the opinion of the company's management, the stock of goods must be sold in order for the trade to be considered successful.
Each industry has its own standards. Some companies have different standards for different product groups. So, for example, our trading company used the following norms (turnovers per year):
- construction chemicals – 24;
- varnishes, paints – 12;
- plumbing – 12;
- facing panels – 10;
- rolled floor coverings – 8;
- ceramic tiles – 8.
In one of the chain supermarkets, the turnover rate for the non-food group is divided on the basis of ABC analysis: for goods A - 10 days, for goods of group B - 20 days, for C - 30. In this retail network, monthly turnover is included in the inventory indicator, and The inventory balance in the store consists of the turnover rate plus safety stock.
Also, some financial analysis specialists use Western standards.
Example:
“Usually, merchants of industrial goods in Western enterprises have a turnover ratio of 6, if profitability is 20–30%,” writes E. Dobronravin in the article “Turnover ratio and level of service - indicators of inventory efficiency.” – If the profitability is 15%, the number of turns is approximately 8. If the profitability is 40%, then a solid profit can be made by 3 turns in a year. However, as noted earlier, it does not follow that if 6 turns is good, then 8 or 10 turns are better. These data are indicative when planning general indicators.”
Henry Assell, in his book Marketing: Principles and Strategy, writes: “In order for businesses to operate profitably, their inventory must be turned over 25 to 30 times a year.”
An interesting method for calculating the turnover rate is proposed by Dobronravin E. He uses a Western development that takes into account many variable factors: the frequency with which goods are ordered, transportation time, delivery reliability, minimum order sizes, the need to store certain volumes, etc.
What is the optimal amount of inventory turnover that can be included in the plan of a particular enterprise? Charles Bodenstab analyzed a large number of companies using one of the SIC systems in inventory management. The results of the empirical study were summarized in Formula 5.
f in the proposed formula is a coefficient that generalizes the effect of other factors influencing the theoretical number of revolutions. These factors are:
- breadth of assortment in storage, that is, the need to store slow-moving stocks for marketing purposes;
- larger than required purchases in order to obtain volume discounts;
- requirements for a minimum purchase quantity from the supplier;
- supplier unreliability;
- economic order quantity (EOQ) policy factors;
- overstocking for promotional purposes;
- use of delivery in two or more stages.
If these factors are at normal levels, then the coefficient should be about 1.5. If one or more factors have an extreme level, then the coefficient takes the value 2.0.
Example:
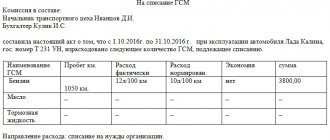
The store has factors (they are indicated in Table 6) applied for different suppliers.
You can give several examples of what the turnover rate will look like when the formula is applied (see Table 7).
TABLE 6. Store Factors for Suppliers
This means that if on average we import goods 3 twice a month (0.5) and transport them for 1 month, despite the fact that some factors (perhaps the supplier is unreliable) are not ideal, then the turnover rate can be considered 9.52. And for product 5, which we rarely import (it takes a long time, and the influencing factors are very far from ideal), it is better to set a turnover rate of 1.67 and not demand too much from its sale.
TABLE 7. Calculation of turnover rate
But the practice of Western companies is very different from Russian conditions - too much depends on logistics, purchase volumes and delivery times, supplier reliability, market growth and demand for goods. If all suppliers are local and turnover is high, then the coefficients can reach 30–40 turnovers per year. If supplies are intermittent, the supplier is unreliable and, as often happens, demand fluctuates, then for a similar product in a distant region of Russia the turnover will be 10–12 turns per year, and this is normal
Turnover rates will be higher for small enterprises working for the final consumer, and much lower for enterprises producing products of group A (means of production) - due to the length of the production cycle.
Again, there is a danger of roughly following the standards: for example, you do not fit into the turnover standard and begin to reduce your safety stock. As a result, there are failures in the warehouse, there is a shortage of goods and unsatisfied demand. Or you start to reduce the order size - as a result, the costs of ordering, transporting and processing goods increase. Turnover increases, but availability problems remain.
The norm is a general indicator, and you should react and take action as soon as some negative trend is detected: for example, inventory growth is outpacing sales growth, and at the same time as sales growth, inventory turnover has decreased.
Then you need to evaluate all the products within the category (perhaps some individual items are purchased in excess) and make informed decisions: look for new suppliers who can provide shorter delivery times, or stimulate sales for this type of product, or give it a priority place in hall, or train salespeople to advise customers on this particular product, or replace it with another more well-known brand, etc.
Buzukova E.A., consultant on assortment management, head of the Super-Retail club
“Sales business/Sales” / No. 5 May 2006 / Toolkit
Automate routine procurement processes,
make the buyer's job easier
the “Purchasing Assistant” solution for 1C: Trade Management 10.3 and 11 will help.
Methods for analyzing and accounting for inventory levels
Because there are multiple ways to account for inventory, and some industries require more reserves than others, comparisons tend to be most meaningful for companies that use the same accounting methods in the same industry. Only then will the determination of “high” or “low” inventory levels reflect reality.
For these reasons, and because changes in the prices of goods and other materials are a factor affecting the value and volume of a company's reserves, it is important to understand how a firm accounts for its inventory.
In domestic practice, two methods are traditionally used: calculation and balance.
Calculation method
This method uses the amount of inventory and turnover and monitors their changes. The use of the calculation method implies an inventory
, i.e. a complete count of all goods and their quantitative assessment.
This method is the most labor-intensive and unprofitable, since during the inventory the enterprise, as a rule, is idle.
Balance sheet method
This method has been widely used in the analysis of the economic activities of an enterprise. With its help, disproportions are revealed, unused reserves are identified, and new proportions are outlined and justified.
This method is considered more profitable and is capable of providing operational accounting and analysis of the enterprise's inventory.
Unfortunately, due to the inability to remove all kinds of unidentified losses from the calculation, the final results are somewhat distorted. To avoid errors in the calculation of inventory, the data for the formula must be systematically compared with inventory balance calculations.
Analysis of turnover measurement results
When comparing, you can build a “Turnover-Margin” matrix and see which products bring us more profit over the same period, and which bring us less.
Comparative data on margin and turnover
| Product | Purchase price | Selling price | Margin | Turnover (days) | Turnover (once a month) | Profit from one unit of goods per month | Priorities |
| product 1 | 20 | 60 | 40 | 40 | 0,75 | 30 | 10 |
| product 2 | 19 | 48 | 29 | 20 | 1,5 | 43,5 | 7 |
| product 3 | 21 | 80 | 59 | 30 | 1 | 59 | 3 |
| product 4 | 18 | 36 | 18 | 10 | 3 | 54 | 4 |
| product 5 | 13 | 36 | 23 | 5 | 6 | 138 | 1 |
| product 6 | 16 | 35 | 19 | 12 | 2,5 | 47,5 | 5 |
| product 7 | 12 | 33 | 21 | 15 | 2 | 42 | 8 |
| product 8 | 15 | 45 | 30 | 12 | 2,5 | 75 | 2 |
| product 9 | 19 | 50 | 31 | 20 | 1,5 | 46,5 | 6 |
| product 10 | 19 | 40 | 21 | 20 | 1,5 | 31,5 | 9 |
As you can see, product 5, although it has an average trade margin, has the best turnover of all and brings the greatest profit per month per unit of product. And product 1, which has a high margin, shows the worst turnover. Consequently, the monthly profit per unit of production is minimal. What can be done? It is necessary to find out what is causing such poor turnover - excess inventory or poor sales? After that, take action. If the problem is in sales, then stimulate turnover. If the problem is excess inventory, then you need to stop importing goods in huge quantities.
Matrix "Turnover-Margin"
By correlating two parameters - margin (or trade margin) and turnover, you can distribute goods within one category according to this matrix.
As you can see, the most interesting for us are products that have a high turnover and a high markup. The assortment may also contain goods with low turnover, but this must be compensated by a high markup. Products with a low markup may be included in the assortment subject to conditions. That they have good turnover, that is, the company does not spend money on selling these goods. Products with low markups and poor turnover should not be included in the assortment.
If such products are present in the matrix, then we can do the following:
• remove them from the range. However, “mechanical cleaning” is dangerous because we can “throw away” both new goods and related goods, components or image goods along with illiquid assets. Therefore, before we “throw out” someone, we need to analyze the history of this product and understand its role in the overall assortment. • convert them into the “high markup - low turnover” square. You need to understand what kind of product it is that is selling slowly. Perhaps this is an expensive image product, and we simply positioned it incorrectly and are not making enough profit. • translate it into the “low markup - high turnover” square, stimulating sales or reducing the amount of inventory.
Sometimes it happens that we have to put up with the fact that we have poor turnover for some goods and this is not the fault of the buyer or sales. These are conditions that cannot be adjusted. This is usually due to delivery conditions - for example, the supplier goes on vacation (closes the plant for maintenance for two months) and in order to provide the company with supplies, it is necessary to purchase a two-three month supply. Or the delivery of goods takes so long (for example, a container by sea from China) that to ensure uninterrupted supply it is necessary to purchase goods in large quantities. You need to understand that this is the price of business...
Analysis of inventory and product turnover
To ensure that all records are up to date and accurate, businesses manually take inventory at the end of each accounting period.
Any difference found between the inventory on a company's balance sheet and what is actually on hand is called "shrinkage." Sometimes goods are lost, sometimes they are stolen. These factors cannot be discounted.
For analysis, enterprises most often use the average amount of inventory for a certain period.
This value is calculated by the formula:
TZsr = TZ1/2 + TZ2 + TZ3 + TZ4 + … TZn /2,
where TZsr is the average inventory for the required period;
TZ1, TZ2, TZ3... TZn - the value of TZ for individual numbers of the analyzed period;
n - dates for which the analysis is carried out.
A large number of warehouse reserves is not always correct, since the company risks being left with unsold goods that are morally or technically obsolete.
The goal of timely inventory is to minimize the need for storage - ideally, all of it should be sold when the cargo arrives at the point of sale. Keeping track of exactly what a business needs to meet demand is challenging because consumer tastes can change quickly.
Functions of Inventory
There are generally four reasons why companies maintain reserves:
- to meet expected increases in demand;
- protection against unexpected increases in demand;
- after purchasing a large wholesale batch of raw materials at a good price;
- to prevent downtime of an entire factory if one part of the production chain breaks down.
Formulas for calculating turnover
Turnover in days
The number of days required to sell existing inventory (see formula 2).
Sometimes it is also called the average shelf life of a product in days. This way you can find out how many days it takes to sell average inventory.
Example:
The product item “Hand Cream” is analyzed, as an example in Table. 2 shows data on sales and inventories for six months.
Let's calculate the turnover in days (how many days it takes us to sell the average stock of goods). The average stock of cream is 328 pieces, the number of days on sale is 180, the sales volume for six months was 1,701 pieces.
Obdn = 328 pcs. ( 180 days / 1701 pieces = 34.71 days.
The average supply of cream turns over in 34–35 days.
TABLE 2. Sales and inventory data for the position “Hand Cream”
Turnover in times
How many revolutions does a product make during a period (see formula 3).
The higher the company's inventory turnover, the more efficient its activities are, the lower the need for working capital and the more stable the financial position of the enterprise, all other things being equal.
Example:
Let's calculate the turnover in revolutions (how many times the stock is sold in six months) for the same cream.
1st option: Image = 180 days. / 34.71 = 5.19 times.
2nd option: Image = 1701 pcs. / 328 pcs. = 5.19 times.
Inventory turns over on average 5 times every six months.
Product inventory level
An indicator that characterizes the store’s supply of inventory on a certain date, in other words, how many days of trading (given the current turnover) will this inventory last (see formula 4).
Example:
How many days will our existing supply of cream last?
Utz = 243 pcs. ( 180 days / 1701 pieces = 25.71.
For 25–26 days.
You can calculate turnover not in pieces or other units, but in rubles or other currencies, that is, by cost. But the final data will still correlate with each other (the difference will only be due to rounding of numbers) - see table. 3.
TABLE 3. Final data for the calculation of Obdn, Obr, Utz


![My business [CPS] RU](https://disagroup.ru/wp-content/uploads/moe-delo-cps-ru-330x140.jpg)