One of the most important indicators of work efficiency in trade is the turnover of goods; using a special formula, it is easy to carry out calculations and sell the most profitable items in the assortment. Using this criterion, entrepreneurs can determine how effectively they are investing in inventory. The length of the cycle from purchase to sale can be judged by the business activity of the company and how competently the financial resources available to the business are used.
Business Solutions
- shops clothing, shoes, groceries, toys, cosmetics, appliances Read more
- warehouses
material, in-production, sales and transport organizations Read more
- marking
tobacco, shoes, consumer goods, medicines Read more
- production
meat, procurement, machining, assembly and installation Read more
- rfid
radio frequency identification of inventory items More details
- egais
automation of accounting operations with alcoholic beverages Read more
Basic Concepts
Warehouse stocks cover demand and guarantee supply. Their size and structure depend on the turnover of a particular company. In order for the proportion between trade turnover and warehouse to remain ideal, it is necessary to analyze the sales speed and reserve volume, their ratio. Answering the question of what product turnover is, in simple words, it should be noted that this is a ratio that shows how many times during a period a purchase will be sold or how many days it will take to empty the warehouse premises. The calculations take into account average values.
To obtain the most objective picture, it is not recommended to take large deliveries to order, because they distort the real situation without going through the storage stage. To characterize balances and receipts, trade balances are compiled in retail and wholesale trade organizations. It provides information about the movement of products, how much and what was purchased and sold.
To determine how product turnover is calculated, three criteria are required:
- Volume of inventory for the period.
- Settlement period. It is determined by the business owner based on the feasibility and specifics of the product. For example, for perishable goods it takes a week, and for construction – from 6 months.
- Trade turnover (sales) for the same time.
To get an objective assessment, you need to consider the following recommendations:
- The comparison is carried out for the same assortment groups.
- The indicator will help optimize activities only where there is a warehouse.
- Capitalized items that are available are taken into account.
- The coefficient is calculated in physical or monetary terms, at purchase prices.
- The results obtained are observed and analyzed over time.
If products are sold slowly, then the efficiency of using working capital will be low, but if the speed is too high, then the consumer may be faced with a lack of the desired item in the warehouse. Therefore, you should not strive for the absolute minimum.
“Turnover” and its coefficient mean the same thing. Both concepts determine how many times the balances were in the operating cycle with a given period of time. You can calculate it by individual items, groups, suppliers, brands, in rubles and kilograms for a week or six months.
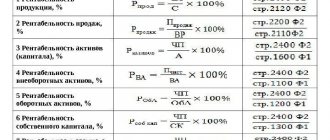
Equity turnover ratio
The ratio shows the rate of turnover of equity capital or the activity of funds at risk to shareholders:
Equity turnover ratio = Revenue / Average equity capital
Equity turnover period (in days) = Duration of the reporting period / Equity turnover ratio
Kosk = page 010 f. No. 2 / ((pages 490-244-252+640+650)ng + (pages 490-244-252+640+650)kg f. No. 1) / 2
or
Kosk = page 010 f. No. 2 / (page 490ng + page 490kg f. No. 1) / 2
Kosk = line 2110 No. 2 / 0.5 x (line 1300 at the beginning of the year + line 1300 at the end of the year)
If this ratio is too high, then this means a significant excess of sales over invested capital, which entails an increase in credit resources and the possibility of reaching the limit when creditors are more involved in the business than owners. In this case, the ratio of liabilities to equity increases, the security of creditors decreases, and the company may have serious difficulties associated with a decrease in income. On the contrary, a low ratio means the inactivity of part of one's own funds. In this case, the coefficient indicates the need to invest one’s own funds in another source of income that is more appropriate to the given conditions.
It is useful to compare the values of the equity capital turnover ratio with the values for the same period of the operating capital turnover ratio
. Functioning capital is the amount of own working capital that is constantly involved in turnover, i.e. the difference between own working capital and long-term accounts receivable along with overdue accounts receivable. The coefficient is calculated using the formula:
Operating capital turnover ratio = Revenue / Average operating capital for the period
By analyzing the values of this coefficient, you can see a slowdown or acceleration in the turnover of capital directly involved in production activities. The resulting values of this coefficient are cleared, in comparison with the indicator of total asset turnover, from the influence of enterprise investments that do not have a direct impact on sales volume, with the exception of investments in their own development.
Business profitability
It should be noted that business activity is characterized by a group of settlements. All of them are expressed in times and days. In addition to speed, inventory movements calculate business activity:
- capital
- assets
- accounts payable and receivable
- investments.
All these coefficients are very important for entrepreneurs because they:
- They adjust the turnover rate and affect costs.
- With a short cycle, the size of the gross parameter is increased for the entire reporting period.
- They are interconnected, so acceleration at one stage leads to savings in time and costs at each level.
Ultimately, the profitability, profitability and financial attractiveness of a company depend on when the investment is returned and how quickly it generates income.
Accounts receivable turnover ratio. Formula
Accounts receivable turnover ratio - shows the effectiveness of the enterprise's accounts receivable management. The indicator is the ratio of sales revenue to the average annual value of receivables. The formula for calculating the indicator is as follows:
Accounts receivable turnover is analyzed over time. The table below shows the relationship between the nature of the trend change and the financial condition of the enterprise.
| Kodz ↗ | The accounts receivable turnover ratio is increasing. The level of efficiency of accounts receivable management increases, which leads to an increase in the solvency of the enterprise due to an increase in the speed of debt repayment by debtors. |
| Kodz ↘ | The accounts receivable turnover ratio decreases. Reduced efficiency of accounts receivable management, increased debt repayment period by debtors, decreased solvency in the short term. |
The value of the indicator depends on the field of activity of the enterprise, therefore, when assessing the optimal value of the coefficient, it is necessary to compare it with industry average values. Read in more detail: “Receivables turnover ratio using the example of OJSC ALROSA.”
Relevance for the store
The chain involves positions on the seller’s shelves and in the warehouse. Sometimes the goods turnover formula includes what has already been paid for, but not delivered from the supplier. By analyzing the data obtained, it is possible to prevent overstocking of retail outlets. There are many more factors that influence the value in practice than in theory. The most significant of them:
- efficiency of the supply manager;
- warehouse workflow speed;
- prompt delivery and display of products;
- inventory standards established in the organization.
The calculation is simplified by special programs that are offered.
Working capital turnover ratio. Balance formula
The calculation formula is as follows:
Working capital turnover ratio = Sales revenue/Current assets
What needs to be noted is that current assets are taken as the average value at the beginning and end of the reporting period. You need to add the value at the beginning of the period with its end and divide by 2.
According to the new form of balance sheet (after 2011), the working capital turnover ratio will be calculated as follows:
Working capital turnover ratio = line 2110/(line 1200ng.+line 1200kg)*0.5
According to the old form of the balance sheet, the ratio was calculated as follows:
Working capital turnover ratio = line 010/(line 290ng.+290kg)*0.5
Working capital turnover indicator
Together with the working capital turnover ratio, it is useful to calculate the turnover ratio , which is measured in days. Formula for calculating working capital turnover:
Current asset turnover = 365/Current asset turnover ratio
Sometimes in calculations for a place of 365 days they take 360 days.
Calculation of indicators
Example 1. Based on the results of inventory in a grocery store, at the beginning of the month the inventory reserve was 250,000 rubles, at the end - 280,000 rubles. At the same time, the revenue was 1 million rubles.
SZsr = 250+280/2 = 265 tr.
OB = 1000,000/265,000 = 3.77 - the number shows how much goods were sold per month.
To calculate how long it will take you to fully sell your balances, use one of the methods:
- OB = SZsr * number of days / OP (OB = 265,000 x 30 / 1,000,000 = 7.95 (days).
- OB = Number of days/coefficient (OB = 30/3.77 = 7.95 (days).
The result obtained suggests that without replenishing the stock of goods, the organization will work for 8 days, while completely selling its warehouse resource.
Together with the considered index, the criterion of the level of inventory is used. It shows how many days of work will be enough to sell out one product niche.
Example 2. According to estimates as of June 30, there were 150 packs of baby food left. Within a month, 350 pieces were sold.
150 x 30/350 = 12.8 (days) - the figure indicates that the balance is enough for 12 days, and then it needs to be replenished.
The effectiveness of the indicator for practical use increases if it is taken together with “leaving rate” - a value that is associated with sales of a product name per 1 sq.m of retail space. It is especially important to take it into account when excluding one or another line from the store’s product range.
Coefficient value
Let's say the company's TAC indicator has been calculated. Now let's figure out what it means. According to the conditions of our example, it turns out that for one ruble of the organization’s own funds there are 1.61 rubles of revenue.
Note that if the coefficient is less than or equal to the value of “1”, then we can conclude that the company is operating at a loss or that income barely covers the costs incurred.
OAK is a business activity ratio. Therefore, the higher the ratio, the higher the profitability of the enterprise. However, the value should be calculated over time, that is, in comparison with several reporting periods. This approach will allow you to analyze in detail the increase or decrease in turnover.
When calculating the ratio, it is necessary to take into account the structure of assets. Thus, a low indicator (up to one) may be caused by an increase in inventories, receivables or property of the enterprise in the reporting period. For example, an organization plans to expand production, and for this purpose machines, equipment, structures and materials are purchased.
Timely analysis of this ratio allows you to obtain reliable information about the financial condition of the organization and profitability indicators. If deviations or reductions in TAC are detected, the management of the enterprise must make appropriate management decisions.
Business Solutions
- the shops
clothes, shoes, products, toys, cosmetics, appliances Read more
- warehouses
material, in-production, sales and transport organizations Read more
- marking
tobacco, shoes, consumer goods, medicines Read more
- production
meat, procurement, machining, assembly and installation Read more
- rfid
radio frequency identification of inventory items More details
- egais
automation of accounting operations with alcoholic beverages Read more
Goods turnover ratio: calculation
In foreign practice, it is designated as inventory turnover and shows how many times during the period the existing stocks were sold out and renewed. In addition to the monetary and quantitative characteristics of the activity, it indicates how effectively management is carried out in the field of supply, logistics and rationing of the commodity reserve, determines the qualitative characteristics of management, and identifies warehouse illiquid stock.
Its peculiarity is that it helps to regulate profits in each operating cycle. Calculated as a ratio to the average inventory volume:
- cost of goods turnover;
- sales revenue.
The first method is used less frequently because it distorts the result depending on the accounting policy adopted by the enterprise.
OB = OP / SZ, where OB is turnover, and OP is sales volume. SZ – warehouse inventories, which can be determined using the arithmetic average of the days of the period: SZ = SZ 1/2+ SZ 2+ SZ 3+…. SZ N/2.
How to calculate product turnover per month
To implement tactical operational management, it is convenient to compare the dynamics of monthly counts. It is removed in two ways.
Example 3. Accounting balances on the 1st day amounted to 150,000 rubles, on the 30th – 210,000 rubles, while the monthly turnover was 750,000 rubles.
SZ = 150 tr. + 210 tr. /2 = 180 t.r.
K rev = 750 t.r / 180 = 4.17
- ABOUT days = 180 x 30 days / 750 = 7.2
- ABOUT days = 30 days/ 4.17 = 7.2
With software from Cleverence, you don't need to calculate anything yourself. The main thing is to understand the economic meaning of these categories and their importance for profitable trading. You need to fill out the data, clearly enter receipts and shipments.
How to calculate product turnover in days
To make practical use more convenient and as useful as possible, the value is calculated over a certain time. This way you can determine how many days of work the purchased items will last, when you need to replenish the warehouse, and how often the “order/payment/delivery/storage/sale” cycle is repeated.
How to calculate the turnover ratio for a group of goods?
Example 2:
For a group of goods, the logic for calculating turnover represents the following sequence of actions:
- Select period
- Calculation of sales amount by product group
- Calculate the amount of balances for a group of goods for each day
- Calculate average inventory
- Calculate turnover ratio
| Product 1 | Product 2 | Product 3 | |||||
| Sales | Leftovers | Sales | Leftovers | Sales | Leftovers | ∑ Remaining | |
| 1 | 6 | 10 | 7 | 15 | 13 | 29 | 54 |
| 2 | 4 | 5 | 3 | 12 | 10 | 20 | 37 |
| 3 | 2 | 12 | 8 | 4 | 6 | 15 | 31 |
| 4 | 7 | 7 | 2 | 5 | 3 | 12 | 24 |
| 5 | 4 | 8 | 1 | 8 | 2 | 10 | 26 |
| 6 | 5 | 5 | 7 | 3 | 8 | 15 | 23 |
| 7 | 2 | 6 | 5 | 7 | 5 | 11 | 24 |
| ∑ sales | 30 | 33 | 48 | ||||
Sales for the period = 30+33+48=111 units
Now you need to calculate the inventory turnover ratio for the week = 111/30 = 3.7 times
How to calculate the turnover ratio of goods in a warehouse for a month: its norm
Economics is such a science that, having understood the methodology for obtaining data, it is important to establish standards. They are needed to understand whether you got a good result or whether you urgently need to take measures to change the situation. After all, finding the “golden mean” is not easy. The owner is interested in a short “product/money” cycle, in the absence of overstocking, and the buyer, with a high turnover rate, may encounter a shortage and not have time to buy the necessary products.
There is no value that would be accepted as an ideal standard. This is due to the fact that the readings are influenced by a large number of subjective and specific factors, from shelf life to the qualifications of suppliers. Trade is conducted differently in large cities and remote villages. When analyzing the information received, you need to focus not on standards, but on dynamics, while comparing the same assortment groups with each other.
Working capital turnover ratio. Calculation using the example of OJSC Rostelecom
| We will calculate the working capital turnover ratio at OJSC Rostelecom, which is the largest telecommunications company. Included in the Moscow Exchange blue chip index. |
Calculation of the turnover ratio of working capital (assets) for OJSC Rostelecom. Enterprise balance sheet
Calculation of the turnover ratio of working capital (assets) for OJSC Rostelecom. Gains and losses report
To calculate the coefficient, public reporting is sufficient, which can be taken from the company’s official website. Let's take 4 reporting periods (each quarter), so we can cover the whole year for our diagnostics. Since the calculation of the coefficient uses data at the beginning and end of the reporting year, in our case we will get 3 calculated coefficients for 4 reporting periods.
Working capital turnover ratio 2014-1 = 73304391/(112128568+99981307)*0.5 = 0.69 Working capital turnover ratio 2014-2 = 143213504/(99981307+96694304)*0.5 = 1.45 Coe working capital turnover ratio 2014-3 = 214566553/(96694304+110520420)*0.5 = 2
The value of the coefficient has increased over the year. We can conclude that OJSC Rostelecom has increased its efficiency. This is largely due to the fact that revenue increased. It was the increase in revenue that led to an increase in the values of the coefficient, since the value of fixed assets (line 1200) did not change much.
Product turnover analysis
In addition to the time it takes to complete one operating cycle, analysts always pay attention to profitability, so they productively structure the entire list of products according to the degree of importance for the company. This classification makes it possible to objectively evaluate the assortment according to two criteria: turnover rate (A) and marginality (B).
Products can be divided into each direction. According to A:
- Significant, accounting for the bulk of sales and profits.
- Average.
- Problematic. The specificity of the third category is that not only “outsiders” fall into this category; they cannot be rejected outright. Most likely, there are new products here, basic models that are sold at a purchase price, but attract customer traffic.
By B:
- Stable volumes.
- Small demand deviations in the range of up to 25%.
- Unpredictable turnover.
The purpose of ranking is to identify a group and select an individual approach to determining standards and balances. It can be analyzed according to two criteria: dynamics and comparison. Based on this, the following types of analysis are used:
- Dynamic – calculated sequentially for equal periods. The change in the obtained result is assessed and appropriate decisions are made.
- Comparative – used to consider similar product categories of different brands, for example, cookies or juices.
Why do we need a product turnover formula?
Now we need to determine what we want to analyze by calculating product turnover using the formula. For example, your “Autumn Waltz” chocolates are sold unevenly in different stores. Then it would be logical to compare turnover across different stores. Or, for example, you want to reduce the assortment and decide which products make sense to withdraw from sale. To do this, we will use an analysis of turnover by brand or product position of different manufacturers of the same product (it is obviously not worth comparing the turnover of vodka and herring).
What does analytics give us?
You cannot be superficial when it comes to business activity calculations. Their purpose is not only to highlight the groups that are the fastest to implement and return money to circulation. With these ratios, managers will be able to:
- select the optimal purchase batch size;
- draw up a delivery schedule for each item;
- plan shipments;
- systematize the warehouse workflow.
The only condition is to work not with static information, but to constantly compare “was/has become” and conduct checks on similar categories of nomenclature. For example, if indicators have decreased by 70% over the year, this means that demand for the product has increased and purchase volumes need to be increased. And batches with a high turnover rate may be underpriced, which means profitability will lag. This is a signal to revise the pricing policy.
Why do we need analysis of turnover of current assets?
The dynamics of indicators characterizing the turnover of working capital are necessarily disclosed in the information accompanying the financial statements (clauses 31, 39 of PBU 4/99), as part of a group of coefficients that allow interested users of the financial statements to assess the financial stability, liquidity and business activity of the enterprise. Current assets and their fair valuation are subject to careful verification during the audit of financial statements.
Proper management of funds in circulation allows you to effectively attract credit sources to finance current activities. To assess the creditworthiness of an enterprise, banks use well-known indicators for assessing financial and economic activities. Based on the ranking of these indicators, the company is assigned a certain rating, which determines the terms of the loan, including the loan rate, the amount of collateral and the loan term. Current assets can also serve as collateral for loan obligations.
The presence of a system of analytical coefficients greatly facilitates the dialogue with tax authorities if it is necessary to explain the reasons for seasonal losses. Current assets may cause VAT deductions to exceed the amount of VAT accrued.
Let's consider the procedure for calculating turnover indicators.
Practical use of calculation
The coefficient is especially significant in the B2B segment and large retail chains. Many retailers set turnover standards that should not exceed three months. This is due to the fact that during this period:
- the product becomes recognizable;
- the price is optimized;
- quality meets customer expectations;
- the marketing concept is developed correctly;
- accounts receivable and accounts payable do not grow;
- deferred payments are repaid on time, the credit line is used rationally.
To calculate the size of warehouse inventory, a single turnover indicator is not enough. To develop the concept, the two-criteria analysis discussed above is used.
However, the average inventory balance depends on the turnover rate. Let's consider possible combinations:
- A low Cob and a significant level of inventory in the warehouse most likely indicates overstocking.
- Rapid turnover with small balances can constantly lead to a shortage of one or another item.
- Low Cob and minimal inventories may indicate stable trade in a specific product, for example, collectible tea or wine.
- If the speed is high and the company can afford to invest heavily in inventory, demand will be met without difficulty, and the store shelves will not be empty.
Business Solutions
- the shops
clothes, shoes, products, toys, cosmetics, appliances Read more
- warehouses
material, in-production, sales and transport organizations Read more
- marking
tobacco, shoes, consumer goods, medicines Read more
- production
meat, procurement, machining, assembly and installation Read more
- rfid
radio frequency identification of inventory items More details
- egais
automation of accounting operations with alcoholic beverages Read more