Hello, Vasily Zhdanov is here, in this article we will look at the profitability of an enterprise. An objective indicator of the economic efficiency of an enterprise is profitability. This concept translated from German literally means: profitable, profitable.
Using profitability, you can find out how effectively the material, labor, financial, and investment resources of an enterprise are used in practice. That is, is it successful at the moment or not, what is its real financial potential and degree of payback.
In order to analyze the profitability of an enterprise, you need to calculate its corresponding coefficient (numerical indicator). When calculating the coefficient, the following generally applicable standards should be taken into account:
- in the general case, the calculation is made as profit to specific resources (revenue, cost, assets);
- The profitability ratio is expressed either in profit per 1 unit. invested funds or in the profit that each 1 monetary unit contains;
- This indicator is most often displayed as a percentage.
To adequately assess the profitability of the enterprise as a whole, several factors should be analyzed. First of all, income, assets, sales, equity. The obtained data about the enterprise and its individual components make it possible to predict its further development and understand how appropriate it is to invest in it. This coefficient is often calculated before applying for a loan or credit and in other situations.
Basic formula for calculating enterprise profitability
There is a general simplified universal formula, a certain basis according to which you can calculate and evaluate the level of profitability of an enterprise. It is easy to use and is most often used when planning profits, i.e. for the future. When calculating using this formula, data from accounting (statistical) reporting for specific periods is used. The calculation scheme will be as follows.
Thus, you will first need to calculate the enterprise’s profit for a specific period and determine the indicator whose profitability is assessed. This could be, for example, equity capital or assets of the enterprise. Next, using these values, the required profitability ratio is calculated using the formula indicated above.
Let's say, relatively speaking, the total income of the enterprise is 12 million. rubles, and total expenses (acquired assets) – 10 million roubles. rub. Then the calculation of profitability using the basic formula will be as follows: (12 million - 10 million) / 10 million x 100% = 20%.
In general, it should be noted that profitability can be calculated in different ways. The calculation option depends partly on the industry in which the company operates, as well as the goals of the analysis. That is, depending on what needs to be assessed: the financial capabilities of the enterprise, its ability to repay debts in a timely manner, or it is necessary to conduct a detailed analysis of the financial situation, etc.
Standard value of gross profitability indicator
A single standard value for the gross profitability indicator has not been established. The return on investment in various sectors of the economy is difficult to calculate in detail, so profitability standards may differ depending on the industry and the specifics of the enterprise. At best, the indicator shows positive dynamics and an upward trend. Its increase means an increase in the share of profit in the revenue structure.
| Change of coefficient | Coefficient value |
| The growing profitability of the enterprise's gross output means a decrease in production costs, and therefore an increase in production efficiency. |
| A decrease in the coefficient reflects an increase in production costs, and therefore the efficiency of use of production assets has decreased. |
| In the case when the gross profitability of an individual enterprise exceeds the average profitability of the industry, we can say that it uses production capacity more efficiently than other enterprises in the industry. |
| If the gross profitability of an individual enterprise is lower than the average profitability for the industry, it means that the profitability of its production assets is lower than that of other enterprises in this industry. |
Types of profitability and their coefficients, as well as calculation options with comments
The profitability of the entire enterprise is influenced by various factors, which are also subject to evaluation. Accordingly, the following main types are distinguished:
- ROA (return on assets). The profitability of an enterprise is determined by the invested funds.
- ROE (return on equity). The return on internal investment (own funds) is determined.
- ROS (return on sales). Displays the share of profit in each monetary unit received.
- ROL (return on staff). Shows the level of professional training of personnel and the optimal use of it.
There are also other profitability ratios: ROM (products), ROIC (invested, permanent capital), RONA (net assets) and so on. Thus, in order to calculate a specific profitability ratio, you should take the general basic formula as a basis and carry out the calculation by analogy, substituting the required values.
For example, if you need to calculate return on equity, the calculation formula could be as follows:
In addition, this coefficient can be calculated in other ways. For comparison, below is another calculation option, which is made before taxes are paid.
Important! In such calculations, the net profit indicator is mostly used.
The remaining indicators are essentially not significant. Meanwhile, one more significant point should also be noted. The most optimal is the ratio of equity capital with the profit that remains after payments (tax, interest), i.e. calculation according to the first formula. If you take the entire amount of profit during calculation (i.e., calculate using the second formula), then the final profitability ratio of equity capital will be clearly overestimated.
Profitability and Profit Analysis
Such indicators should be carried out in several stages. The results obtained are compared with values for previous periods. This approach allows us to identify actual deviations from the chosen business development strategy . It is recommended to carry out these activities at the end of each quarter . As a result of their implementation, specialists are able to identify various risks that affect the volume of incoming profits . It is important to understand that current profit volumes do not always reflect the real state of affairs. Two companies earning the same income may differ in the number of goods sold and production costs. That is why several different indicators are taken into account when assessing a company’s performance.
At the next stage of the process under consideration, all factors that had a direct impact on the amount of income are studied. In such an analysis, it is important to take into account not only the main, but also additional sources of income. When making calculations, it is necessary to take into account the totality of all factors, regardless of their nature.
The higher the gross profit margin, the higher the share of gross profit in the structure of sales revenue
Other formulas for calculating enterprise profitability
As practice shows, most often economists calculate the profitability of an enterprise, goods (services) and assets. And in turn, the results of such calculations indicate that a higher level of profitability is observed with an increase in trade turnover, minimal expenses and a justified (non-excessive) increase in product prices.
When calculating, in addition to the above formula, you can also use other options for calculating profitability. Some of them are shown in the table below.
| Costing object | Formula for calculation | Brief summary of the result |
| Profitability of goods sold | The resulting indicator shows the level of profitability for the required period, which gives grounds for concluding about a future increase (or decrease) in income | |
| Return on assets | A negative indicator obtained during calculations indicates losses | |
| Return on sales | The calculation result displays the corresponding profit level | |
| Personnel profitability | The resulting indicator allows us to judge the productivity of the enterprise, as well as the need to make personnel decisions | |
| OS profitability | The lower the calculated indicator, the less rational the operation of the enterprise |
The profitability ratio can be calculated monthly, quarterly or annually, as well as separately by type of product and other indicators noted above. The results obtained can be compared, and then, based on these comparisons, the necessary measures can be taken for the further successful development of the enterprise.
In this way, an economic analysis of the enterprise’s activities is carried out, during which the advantages and gaps of its work as a whole are clarified.
How to calculate business profitability
You can calculate the profitability of a business using several indicators (capital investments, working capital, investments, sales, etc.) At large enterprises, calculations are made based on the balance sheet lines.
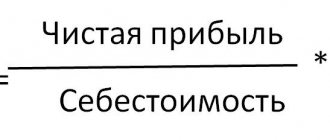
The generalized calculation formula has the form of a fraction, the numerator of which indicates the amount of profit, and the denominator indicates the cost of its formation.
R = P x 100% / I
Where: R – profitability; P – profit; I – costs that form the income of the enterprise.
The smaller the business structure, the easier it is to take into account all the factors affecting its profitability in terms of costs. In other words, analyzing the activities of a company operating with a small number of types of costs is not a problem.
R = P x 100% / (VCm + CCm)
Where: R – profitability; VCm – average annual cost of working capital; CCm is the average annual cost of non-current assets, including fixed assets.
Most often, the annual average values of the costs of working capital (raw materials, components, consumables, energy, etc.) are calculated as the arithmetic average of the states at the beginning and end of the analyzed period. The advantage of a small business is that with a small amount of equipment and a limited range of resources, the same thing can be done with much greater accuracy.
For example, the car worked from January to April, after which it was sold. Its average annual cost will be equal to one-twelfth of the book value multiplied by the number of months of operation:
CCm = CCb x T / 12
Where: CCm is the average annual cost of the main means of production; CCb – book value of the means of production; T – the number of months during which the product was used.
Using the same principle, the average annual value is calculated in the event of forced equipment downtime (for example, due to breakdown).
What is product profitability
This indicator is of paramount importance in the production of commercial products. If you compare the profit brought by a unit of manufactured goods and its cost, then you will get the profitability of a particular product. In turn, profit is equal to the difference between price and cost:
R = P / Q = (PR – Q) / Q
Where: R – product profitability; P – profit brought by the product after its sale; Q – product cost; PR – selling price of the product.
Example 1. Calculation of return on equity (ROE)
ROE is usually talked about when it is necessary to determine how effective the investment of internal funds was. To calculate this coefficient in the proposed calculation option, the following conditional data are used:
- net profit for the period: RUR 25 million. rub.;
- revenue: RUR 120 million rub.;
- equity capital: RUR 14 million. rub.;
- total size of all assets: RUR 230 million. rub.
Calculation is carried out according to the formula:
Taking into account the available data, the calculation is made as follows:
ROE = (25 million / 120 million) x (120 million / 230 million) x (230 million / 14 million) x 100% = 1.78%
Thus, by analyzing, you can find out, for example, how ROE is affected by such components as asset turnover, ROS (rental sales), and the degree of ratio of equity and debt capital.
What is profitability as an economic parameter
In the broadest sense, profitability can be interpreted as the excess of profits over costs. If less is spent than received as a result, it means that the business brings benefits that can be used, among other purposes, for the development and further improvement of business performance.
Profitability means that the invested funds and resources are used effectively.
By analogy with a deposit, when a person deposits a certain amount in a bank and then takes it back with interest, a profitable business means a certain percentage of “bonuses” that is obtained as a result of actions with the funds initially invested (including fixed assets). For this reason, profitability is usually expressed as a percentage.
FOR YOUR INFORMATION! If expenses exceed the profit received, there is a negative profitability, or a loss.
“Safe” profitability standards by industry (FEA)
Determining the profitability of an enterprise is an important and mandatory action in any industry. This is an important indicator of the profitability of an enterprise. This factor is also taken into account by the Federal Tax Service of the Russian Federation. In this regard, every year the tax service calculates two profitability indicators by industry and publishes the results on its website.
Information on profitability for 2020 is also given in Appendix No. 4 to Order of the Federal Tax Service of the Russian Federation No. MM-3-06 / [email protected] dated May 30, 2007 (as amended on May 10, 2012). Their relevance is determined as of May 24, 2019. These indicators are indicated as percentages and relate to goods (works, services) sold, as well as assets by type of activity.
All information is systematized according to OKVED-2 and presented in table form. First, the specific type of activity is indicated, then the corresponding calculated indicator. As an example, below is a fragment (excerpt) of a table with indicators for individual types of activities.
| Foreign economic activity (according to OKVED-2) | 2018 | year |
| Rent of goods (services...) sold, % | Rent of assets, % | |
| fishing, fish farming | 54,0 | 20,8 |
| mining | 33,6 | 17,3 |
| manufacture of wearing apparel | 9,2 | 8,4 |
| production of medicines and materials used in medicine. purposes | 26,9 | 10,1 |
| construction | 6,1 | 1,7 |
| education | 4,2 | 2,8 |
This Order also presents similar indicators for 2017. It should be noted that they are a kind of guide to action not only for taxpayers, but also for the tax service itself. What are they used for? Usually in order to compare these indicators for a particular payer with similar data for the industry in which it operates. The significant negative difference between them is a reason to think about it.
A taxpayer’s low profitability indicator (i.e., below the industry level) may indicate illegal tax maximization of favorable ratios. For the tax authorities, this fact may serve as a reason to conduct an on-site audit. Therefore, under these circumstances, the Federal Tax Service usually requires, at a minimum, an explanation of why the payer has such low profitability.
For your information, given such a significant role of the above standards calculated by the Federal Tax Service of the Russian Federation, they often talk about “safe profitability by industry” (FEA).
Calculation goals
The nuances of calculating and interpreting ROS depend on the characteristics of the enterprise. Basically the goals are:
- comparison of indicators over time (usually a successful period is taken as a basis, when the return on sales indicator was satisfactory to the management);
- comparison of profitability of sales of different products;
- comparison of company data with similar indicators of competitors;
- forecasting ROS for new products or services;
- obtaining the information necessary to vary the pricing policy;
- monitoring the company's business activity;
- identifying products or services that do not bring the company proper profit and hinder its development.
We can say that ROS is one of the indices showing the economic viability of an enterprise and the efficiency of using available resources (material, labor and others). It is advisable to use this indicator for short-term planning.
Common mistakes when determining enterprise profitability
Mistake 1. Often, when conducting financial and economic monitoring, many specialists try to identify and draw an analogy between profit and profitability. Meanwhile, these are different quantities, absolutely not identical.
It is practically impossible to fully assess the efficiency of an enterprise only on the basis of data on profit, as well as revenue and sales volumes. To obtain a reliable estimate, a more detailed analysis is required by calculating profitability. We can say that this is one of the key indicators. It is with its help that you can find out, for example, what profit one ruble invested in production can give, etc.
Gross Margin Formula
The gross profitability ratio (GPR) shows what share of gross profit is brought by 1 ruble, proceeds from sales of a product, what percentage of gross profit is in the sales volume of the enterprise.
| KVP = GROSS PROFIT / SALES REVENUE = (SALES REVENUE - COST) / SALES REVENUE |
Gross margin is calculated from the balance sheet as follows:
| KVP = page 029 Form No. 2 / page 010 Form No. 2 |
Answers to frequently asked questions
Question No. 1: What has a dominant influence on the profitability of an enterprise?
A number of interrelated factors. In general, these are: the range of goods sold and its changes, the technical side of production, labor productivity, staff, as well as the cost of services and materials that the enterprise receives. The competitiveness of the enterprise and its internal policy are also of no small importance. It is recognized that profitability can be improved by, among other things, increasing profits and reducing costs.
Application of the indicator
The gross profitability ratio is a comprehensive indicator of activity in the context of specific types of profitability. Using its calculation, you can evaluate the efficiency of the commercial departments of any enterprise. Another accurate indicator of efficiency is net profit (the difference between the income and expenses of the enterprise).
Profitability is the ratio of profit and profitability. The gross profitability indicator is often used to assess the effectiveness of large investment projects. The amount of profit from investments is not easy to calculate and difficult to predict.
Profitability analysis is regularly carried out at any normally operating enterprise. The purpose of this direction is to determine the most profitable and most unprofitable areas of business activity and management zones. The results of the analysis are used to select and develop a strategy for each direction, in the long and short term. Strategy is a long-term plan for the development of an enterprise.
If the company has a small staff and the cash flows passing through the company's internal reserves are small, then it is very advisable to take into account not only gross profitability, but also other profitability indicators. Calculate return on assets, production, investment and sales. This approach will allow you to promptly identify weaknesses in the enterprise and take the necessary measures in a timely manner to reduce their impact on profits. But these indicators do not always fully reflect the real situation at the enterprise in the short term.
Formula for product profitability on balance sheet
To calculate the profitability of products, Form 1 of the balance sheet is not required. All information necessary for the calculation is in the statement of financial results (Form 2).
For more information about the balance sheet, see the article “Filling out form 1 of the balance sheet (sample)” , and for form 2 - “Filling out form 2 of the balance sheet (sample)” .
Note! Amendments have been made to the balance sheet and financial statements. Read more about the changes in the material “Changes in accounting statements from 2020”.
We present possible calculation formulas.
- The formula for product profitability based on net profit and total cost is as follows:
Rpr = Line 2400 of form 2 / Sum of lines 2120, 2210 and 2220 of form 2 × 100.
- Product profitability in terms of net profit and production costs is calculated using the formula:
Rpr = Line 2400 of form 2 / Line 2120 of form 2 × 100.
- For product profitability based on sales profit and total cost, use the following formula:
Rpr = Line 2200 of form 2 / Sum of lines 2120, 2210 and 2220 of form 2 × 100.
- And for product profitability in terms of sales profit and production costs - the formula:
Rpr = Line 2200 form 2 / Line 2120 form 2 × 100.
Return on sales, calculated as the ratio of profit from sales and total cost (see calculation formula No. 3 in this section) on average across the country is at 12%. However, it varies greatly across industries. Therefore, you should compare your profitability with the industry average.
Why is profitability calculated?
Every owner of an enterprise, its potential or actual investor, is interested in obtaining information about how efficiently it operates.
Financial analysis helps us evaluate business performance. With its help, you can get an idea of the current activities of the company, or you can make a forecast. Financial analysis is also used before starting, for example, to develop business plans or development strategies. In this case, cost-benefit analysis plays an important role. Profitability is a relative measure of profitability. This is not a single indicator, but a whole system, a set of indicators. The main ones are return on sales, assets, equity, and product profitability. We will talk about the latter in this article.
Read about return on equity in the article “Determining return on equity (formula)” .
Parameter Analysis
A decrease in the economic indicator indicates a drop in demand for the result of the labor of a business entity and a decrease in the competitiveness of its products. To stabilize the situation, the head of the enterprise needs to initiate measures to stimulate demand and improve the quality of the goods produced. As an alternative, it is possible to consider the option of entering into activities in a new market niche.
The trend of changes in the sales performance indicator is assessed in the dynamics of the base and reporting periods. The base period is the past time period in which the indicator showed high levels. It is necessary to enable comparison of the parameter with the indicator accepted as the standard.
Main factors influencing the value of the indicator
The profitability of products calculated for the enterprise as a whole is influenced by several factors. The value of the indicator depends on how it changes:
- structure of sold products. If the share of more profitable types of goods in the total amount of goods sold increases, then the coefficient will increase, but in the opposite case, it will decrease;
- the average value of selling prices, which has a direct impact on the value of the indicator;
- the level of cost of goods, which is inversely related to the level of profitability. An increase in cost leads to a decrease in the value of the coefficient, and, conversely, as a result of a decrease in cost, its value increases.