The concept of return on sales (RP or ROM)
- RP is an indicator that reflects the ability of organizational leaders to control all kinds of costs. This indicator is expressed as a percentage of income and revenue.
- RP coefficient - shows what part of the profit falls on one earned conventional unit.
Let us assume that the financial efficiency of enterprises is almost the same. Enterprises with the shortest production cycle will have a lower return on sales than enterprises with a long-term cycle.
- If the RP is less than zero, then we can conclude that the enterprise is operating at a loss, since in this case the cost exceeds the revenue.
- Zero profitability is a sign that the organization spends exactly the same amount on production as it acquires after sale.
- A positive return on sales means that the project is profitable. The higher the indicator, the better for the enterprise.
It is clear that the profitability indicator is very dependent on the field of activity of the enterprise. For example, in banking this figure can reach 100%, and in heavy industry – even 3%.
The essence of profitability and profitability indicators of an enterprise
In general, profitability means the ability to make a profit.
Although profitability is not always the sole and main goal of an enterprise, it is an important feature that indicates the effectiveness of functioning in market conditions. Comparing profitability indicators with the values of competitors, the requirements of owners, etc. can be said about the quality of work of the enterprise management. The ability to earn a return on invested capital is a key factor in determining the overall value of a company and the value of its securities. Consequently, for many analysts, consideration of profitability is a key focus of their analytical efforts.
Profitability reflects the company's competitive position in the market, expansion opportunities, and the quality of enterprise management. The income statement shows the sources of profits, components of income and expenses. Profits can be distributed to shareholders or reinvested in the company. Reinvested profits improve solvency and provide a financial cushion against short-term problems.
Profitability (as a system of indicators) is a system of indicators that allows you to determine the efficiency and effectiveness of the enterprise and its components in the direction of generating net profit and financial results. It can be used both at the planning stage and in the operational control of the enterprise, as well as at the end of the financial year when carrying out a retrospective assessment of the enterprise.
Increased profitability of sales
An increase in RP is undoubtedly a positive factor for any company.
You can talk about increasing profitability if:
- The analysis revealed that the growth rate of income is greater than the growth rate of costs.
This could be affected by the following:
- Sales volume has increased.
- The range of products produced has changed.
With an increase in demand for goods from buyers, an increase in the number of products sold is later observed. Consequently, due to the work of the production lever, income grows faster than costs. The company's management is able to achieve revenue growth by raising prices for a certain product or completely reducing its range.
- The analysis revealed that the rate of decline in income is much less than the rate of decline in costs.
This can usually lead to:
- raising prices for manufactured products;
- making changes to the structure of the sales range.
These events are considered not entirely positive for the enterprise, and management must be aware of this. After all, profitability indicators look better, but the amount of income decreases.
Revenue growth and cost reduction. This is achieved if:
- changes were made in the sales range;
- cost levels were changed;
- prices increased.
This situation is undoubtedly positive for the organization.
Its reduction
We can talk about reducing RP in the following cases.
Cost growth rate is greater than revenue growth rate
This may be due to the following reasons:
- price reduction;
- changes in the direction of increasing cost levels;
- changes in the structure of the product range.
This situation is not a positive trend. To improve the situation, it is important to think about the organization's pricing as well as how costs are controlled.
The rate of revenue decline is faster than the rate of cost reduction
This situation usually occurs for only one reason:
- Decrease in sales volumes. It is quite normal if an organization, for one reason or another, decides to reduce its production in a certain market. Costs fall much more slowly than revenues due to production leverage.
Increased costs and decreased revenue
Reasons that could influence this fact:
- prices were reduced;
- it was decided to make changes to the structure of the product range;
- cost standards have been increased.
In this situation, it is also advisable to analyze the formation of prices at the enterprise and pay attention to cost control.
Note: If the market is stable, then income, as a rule, changes faster than costs only under the influence of the production lever.
Formula
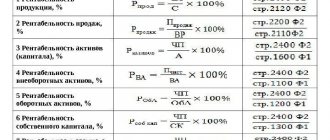
In fact, RP is easy to calculate using numbers that you already know. To do this, you will need to select the appropriate formula from the three listed below and substitute your values. If you do not have specific numbers, you can always find them in the balance sheet.
Calculation of the formula for return on sales
In general, the RP formula looks like this:
RP = profit (loss) from sales / sales revenue * 100%
However, it is also common to calculate gross, operating and net RP. All calculation methods will differ in the numerator, but the denominator always remains the same.
Formula 1: calculation of gross RP
RP = gross profit: sales revenue * 100%
This indicator reflects the share of profit in each monetary unit earned by the enterprise.
Formula 2: calculation of operating profitability (return on sales based on EBIT)
RP = profit (loss) from taxation: sales revenue * 100%
The indicator reflects the share of profit from sales before taxes and interest in each monetary unit earned by the enterprise.
Formula 3: calculating net profitability
RP = net profit (loss): sales revenue * 100%
This indicator reflects the portion of profit that accrues to each ruble invested in the production and sale of products.
Return on assets or economic profitability increased by almost 1.5 times. This, although an insignificant increase, indicates a trend towards increasing efficiency in the use of enterprise property. But the profitability of sales decreased by 3%, which may have been influenced by a decrease in demand for products. Return on equity increased by 2%, i.e. if in the base year equity capital accounted for 14.78% of net profit, then in the reporting year - 16.93% https://sgs-holding.ru buy MDF wall panels - buy MDF panel.
The asset turnover ratio, which characterizes how much sales revenue is accounted for per ruble of assets, increased 1.3 times. The asset turnover period decreased by 137 days, which means that the turnover of funds accelerated.
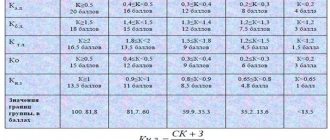
The rating assessment showed that the enterprise has a sufficient amount of its own funds, has high solvency, there is an increase in revenue per ruble of invested funds, an increase in the efficiency of using equity capital, but it should be noted that there is a slight decrease in the profitability of sales due to a drop in demand for products. As a result, the rating assessment remained virtually unchanged during the analyzed period. Thus, in general, the enterprise is financially sound, stable, and independent.
In the reporting year, the value of current assets increased by 2 times. The increase was influenced by the growth of accounts receivable and inventories. The largest share in the composition of current assets is occupied by inventories (62.58%), which increased by 2% compared to last year, and accounts receivable (30.39%), which increased by 10% in the reporting year. But the share of cash decreased by 12.7% compared to last year, which confirms the absolute liquidity ratio, and amounted to 7% of the total current assets. The turnover ratio of current assets increased by 10%, which indicates a slight increase in the rate of working capital turnover. The duration of one turnover in the reporting year decreased and amounted to 359 days.
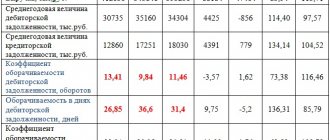
By assessing the composition and structure of accounts receivable, we can come to the following conclusions. The largest share of accounts receivable is occupied by other debtors (97.4%), and accounts receivable for goods, works and services constitute an insignificant part, which indicates that payments are made on time and the terms of the contract are observed. The share of accounts receivable in the total amount of current assets almost doubled compared to last year. The ratio of the average accounts receivable to revenue last year was 0.22, in the reporting year – 0.30. This says that for every ruble of revenue there are 22 and 30 kopecks of receivables, respectively. The share of doubtful accounts receivable is very small, and there is also a downward trend. The accounts receivable turnover ratio decreased by 0.7 times, i.e. 0.7 times less accounts receivable turned into revenue.
The duration of the production cycle decreased by 70 days in the reporting year. The acceleration of inventory turnover occurred at all stages of the circulation. The duration of turnover of raw materials and supplies decreased by 25 days, finished products by 8 days, and work in progress by 37 days. A reduction in the duration of the production cycle indicates an increase in the business activity of the enterprise. The change in the duration of the operating cycle was influenced by a decrease in the duration of the production cycle and an increase in the turnover time of receivables, thus, the total duration of the operating cycle decreased by 42 days. The duration of the financial cycle in the reporting year increased, but only slightly compared to the previous year by 8 days. The loan repayment period decreased by 50 days, which indicates an improvement in the overall solvency of the enterprise.
Own working capital characterizes the financial condition caused by the financing of current assets. The coverage of current assets with own funds amounted to 740,651 rubles in the base year, and 1,286,331 rubles in the reporting year, which is 545,680 rubles more. Net working capital shows how much non-current assets and part of current assets are covered by own funds and long-term sources of financing. The company has enough own and long-term borrowed funds; in the reporting year, the amount of coverage increased by 2.5 times. Growth was influenced by significant attraction of long-term loans and borrowings.
The potential cash surplus in the reporting year remained virtually unchanged compared to the previous year and amounted to 213,090 rubles and 217,894 rubles, respectively. The company does not lack current funding. Due to the acceleration of asset turnover, the relative savings in working capital amounted to 287,466 rubles.
Return on equity increased slightly by almost 3%. It is worth highlighting the factors that contributed to this. The change in the capital structure was influenced by an increase in debt financing, which contributed to an increase in return on equity by 2.08%; the increase in return on equity was also facilitated by the acceleration of asset turnover by 1.3, profitability increased by 2.72%, but a decrease in return on sales reduced profitability equity by 2.05%
Go to page: 9
RP coefficient and its formula
As mentioned above, the profitability ratio reflects the share of the organization’s profit attributable to each conventional unit of earnings. This, in general, is profitability. The coefficient is calculated using the formulas already presented, but not in percentage terms.
How should you calculate the return on sales ratio:
K RP = profit (loss) from sales / sales revenue
The mentioned coefficient can also be calculated using the balance. It can also be calculated not only in general, but also for each individual product or service. This makes sense if it is necessary to analyze the economic activities of any enterprise.
How to interpret the calculated values
For example, the calculated profitability of RP is 25%. This means that for every 100 monetary units of the enterprise, there are 25 units of profit. You can also explain the answer as follows: for every ruble there are 25 kopecks of profit.
Note: By calculating the profitability ratio, we get facts. But having received a specific value, we will never be able to say: this or that investment of capital is profitable or not. For these purposes, for example, asset indicators are calculated.
Economic profitability indicator
This concept is designated in science as profitability, profitability and utility; it characterizes economic efficiency and is relative. It comprehensively reflects the fruitfulness of using the resources of a particular enterprise.
Reserves are considered to be material, labor, monetary and other objects. The coefficient, which shows what the economic profitability of the enterprise is, is calculated based on the ratio of profits to assets. This indicator is important for statistical reporting on the operation of an object.
When conducting a comparative and financial analysis of an enterprise, the indicator of economic profitability is calculated without fail. For a market economy, there is a system of indices (indicators) of profitability (profitability), which can be calculated both as a whole and for individual types. The level and dynamics of the indicator are the main objects of attention of organizational managers, since profitability reflects the achieved balance of internal and external economic interests. The following groups of profitability indicators are distinguished: return on investment, production assets and sales.