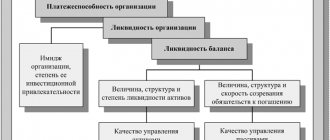
The financial and economic activities of any organization take into account 2 main categories of indicators - absolute and relative. The first category includes profit, sales volume, and total revenue. Despite the undeniable importance of these values, their analysis is not able to fully characterize the economic activities of the enterprise. Relative indicators can provide a more informative picture. These are profitability, liquidity and financial stability ratios. Another important property of relative indicators is that they allow you to compare the characteristics of several organizations. Using the return on assets formula, you can evaluate many important economic indicators of an enterprise.
What does return on assets show?
Profitability is a whole system of indicators that characterize the efficiency of an enterprise. One such indicator is the return on assets ratio. It is usually denoted by ROA (short for return on assets).
This coefficient demonstrates how high the return on funds invested in the organization’s property is, what profit each ruble invested in its assets brings to the company.
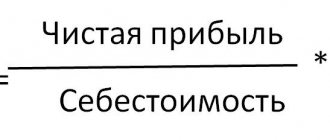
In general, the formula for calculating return on assets can be presented as follows:
ROA = Pr / Ak × 100%,
Where:
ROA - return on assets;
Pr - profit (for calculation, either net profit or profit from sales is taken, depending on what profitability the user is interested in);
Ak - assets of the organization (as a rule, the average value of assets for the period is used for calculation).
Return on assets is a relative indicator, usually expressed as a percentage.
How to use the indicator in analysis
First of all, you need to know what the indicator says. Let's look at our example. 2% is not great, but it's a pretty good average. Return on assets should not be below 0%. If this value is less than zero, it means that the company is operating at a loss, and it is necessary to either seriously rebuild the entire business (which will require large investments) or liquidate the company.
But this is far from the most important point in the analysis. It is much more important to compare the indicators of previous periods with the current one. It shows whether profitability is increasing or decreasing, which in turn leads to certain conclusions.
If the ratio has become higher compared to the previous reporting period, this means that either the enterprise’s profit has increased, which may be due to an increase in asset turnover (turnover is resource productivity, shows how many times a particular asset has paid for itself over a period of time), or expenses for production decreased.
If there is a decrease, this may indicate a decrease in asset turnover and, accordingly, a drop in the enterprise’s profit. This may also indicate an increase in production costs.
Naturally, an increase in profitability is a sign that the enterprise is developing and everything is going well. And a decrease is a signal that something needs to be done. The higher the profitability ratio, the better.
For clarity, we depict all the listed conclusions in the diagram:
Let's give an example of analysis using the return on assets ratio.
How to calculate the profitability of non-current assets (balance sheet formula)
Non-current assets are the so-called long-term assets that the company uses for a long time - more than 12 months. Such property is reflected in section I of the balance sheet. These are fixed assets, intangible assets, long-term financial investments, etc.
When calculating the profitability of assets of this category, the denominator needs to reflect the total for section I - line 1100. Then we will get the profitability of all existing non-current assets.
If necessary, you can analyze the profitability of a particular type of asset, for example, fixed assets or a group of non-current assets (tangible, intangible, financial). In this case, the data on the lines that reflect the corresponding property is substituted into the formula.
The easiest way to calculate the average value of assets is to add the indicators at the beginning and end of the year and divide the sum by 2.
For more information about the balance sheet, see “Filling out Form 1 of the balance sheet (sample)” .
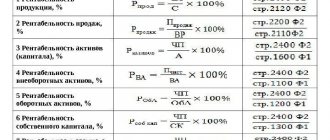
The profit indicators for the numerator of the return on assets formula must be taken from the financial results statement, known to everyone as Form 2:
- profit from sales - from line 2200;
- net profit - from line 2400.
About Form 2, read: “Filling out Form 2 of the balance sheet (sample)” .
Calculation of return on assets ratio
The detailed formula looks like this:
ROA = ((Net profit + interest payments) * (1-tax rate) / (enterprise assets)) * 100%
The assets of the enterprise in the denominator are all cash, including accounts receivable and deposits (liquid sources), as well as raw materials, materials, buildings and structures (less liquid), etc.
The growth of economic results per unit of invested funds depends directly on the tax component and borrowed resources.
Why does an accountant need return on assets?
It is generally accepted that, for the most part, the return on assets indicator is of interest to financiers and analysts who assess business performance and look for growth reserves. However, it is also important for accountants or tax specialists of companies. The fact is that profitability, including return on assets, is one of the criteria for assessing the risk of falling into the tax audit plan provided for by Order of the Federal Tax Service of Russia dated May 30, 2007 No. MM-3-06/ [email protected] A critical deviation is considered to be a deviation in profitability the organization's assets from the industry average by 10% or more.
Return on assets in the main areas of activity since 2006 is given in Appendix 4 to the order of the Federal Tax Service of Russia dated May 30, 2007 No. MM-3-06/ [email protected] Calculate your return on assets and compare it with the industry average. What if you are already under control? You can view the industry average profitability (download Appendix 4 to the order of the Federal Tax Service of Russia dated May 30, 2007 No. MM-3-06 / [email protected] ) on the tax service website.
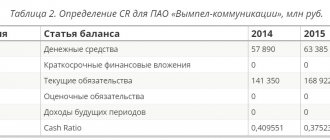
Return on assets ratio: calculation example
GRAN LLC produces household chemicals. It is necessary to calculate profitability for 2013, 2014 and 2020.
From the “Profit and Loss Statement” we take the values of net profit/loss for each year.
2013 - 934,766 rubles. 2014 - 345,870 rub. 2020 — 222,786 rub.
From the “Balance Sheet”, which includes current and non-current positions of assets, you will need the following line:
2013 — 10,234,766 rub. 2014 - RUB 15,345,870 2020 — 18,222,786 rub.
Calculation by year
- 2013 — (934766 / 10234766) * 100 = 9.13%
- 2014 - (345870 / 15345870) * 100 = 2.25%
- 2015 — (222786 / 18222786) * 100 = 1.22%
Conclusion: active savings are growing, but profits are steadily decreasing. This enterprise needs to revise its financial policy, improve the quality of management and distribution of cash flows, and search for markets for its products.
Mathematical formulas and conditional numerical components help to quickly understand the financial condition of an economic entity. They are valuable for managers, company owners, and people interested in the real state of affairs.
A company can fully develop only under the condition of reasonable taxation, the likelihood of receiving high profits as a result of the purchasing power of the population, finding its own reserves of working cash resources without borrowing them at a high interest rate, and avoiding financial dependence.
Top
Write your question in the form below
Results
Calculation of profitability is necessary both for assessing the effectiveness of investments and for planning interaction with tax authorities. If profitability indicators deviate from the industry average by 10% or more downwards, this means that the organization is at risk and can be included in the on-site tax audit plan.
Read about the calculation of other profitability indicators in the following articles:
- “The procedure for calculating the profitability of an enterprise (formula)”;
- “How to calculate product profitability?”;
- “Determining return on equity (formula).”
You can find more complete information on the topic in ConsultantPlus. Full and free access to the system for 2 days.
Standard values of return on assets
In practice, statistical calculations have long been carried out, which helped to determine standard indicators regarding the return on assets of companies operating in different fields of activity.
For clarity, we present them in the table:
| Type of activity of the enterprise | Standard profitability indicators |
| Trade | From 15% to 40% |
| Finance | To 10% |
| Production | From 15% to 20% |
As you can see, all trading enterprises should have a higher return on assets, because they have the lowest amount of non-current assets. But in production, the amount of non-current assets, including equipment, will be large. The competition in finance is very fierce, so such enterprises have a low return on assets.
An example of calculating the profitability of non-current assets of JSOC Bashneft according to RAS
To assess the dynamics of profitability, let’s consider 3 reports published on the official website of JSOC Bashneft based on data published for 2020, 2020, 2013.
| Indicator, thousand rubles. | 2017 | 2016 | 2015 | 2014 | 2013 | 2012 | 2011 |
| Page 2400, thousand rubles. | 129325054 | 43260638 | 52306523 | 65272010 | 69124363 | 45175078 | |
| Page 1100, thousand rubles. | 336055338 | 318768400 | 290938317 | 258018118 | 214428993 | 193340543 | 154765855 |
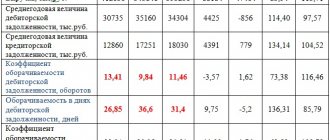
| Profitability = Page 2400 / Page 1100,% | 38,48 | 13,57 | 17,98 | 25,29 | 32,24 | 23,37 |
Based on the calculations, for clarity, a graph of the dynamics of nominal indicators is constructed, on the basis of which one can see the changes in how these data change.
Picture 1
Dynamics of net profit and non-current assets of JSOC Bashneft according to RAS 2012-2017, thousand rubles.
Also important is the visual reflection of the dynamics of profitability, which varies depending on the basic calculated values.
Figure 2
Dynamics of profitability indicators of non-current assets of JSOC Bashneft according to RAS 2012-2017, %
Based on calculated and graphical data according to RAS, it is possible to characterize the dynamics of profitability and the dynamics indicators themselves. The standard indicator for manufacturing enterprises is 15-20%; in the case under consideration, the calculated profitability indicator of JSOC Bashneft is significantly higher; only in 2020 the indicator dropped below 15%, but only slightly. The indicator is not stable because it depends on the amount of profit received, which changes from year to year.
The procedure for calculating the profitability of non-current assets according to IFRS
To calculate profitability under IFRS, data is taken from the companies' consolidated statements. According to IFRS, non-current assets include:
- Fixed assets
- Intangible assets
- Other non-current financial assets
- Investments in joint activities
- SHE
According to IFRS, the formula will be presented:
Return on non-current assets = net profit after taxes / average value of non-current assets
What influences the value of profitability of non-current assets
The combination of factors influencing the final value of profitability of non-current assets is very impressive. The list will include both very serious, external circumstances, which the enterprise cannot influence, and internal ones, subject to adjustment within the organization.
External factors include:
- the market situation in general;
- demand for manufactured products;
- state tax policy and legislative measures regarding enterprises;
- competition within the industry;
- political situation in the country.
Among the internal ones it is important to name:
- high-quality production plan;
- technological process literacy;
- logistics;
- comfortable working conditions and salary level;
- quality of raw materials (and current assets).