The absolute liquidity ratio shows what share of current liabilities the company is able to pay off in the short term. For the calculation, you need to use balance sheet information: from assets - the amount of cash and short-term investments, from liabilities - current liabilities. The normal value of the indicator for Russian practice is from 0.2 to 0.5.
When raw materials suppliers consider entering into a contract with a specific manufacturer, they examine the dynamics of its quick ratio. What does such an analysis give them?
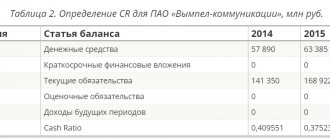
The absolute liquidity ratio (Cash ratio - CR) is a financial ratio that is calculated by dividing the amount of cash and short-term financial investments by short-term liabilities.
The basis for determining CR is the balance sheet of the enterprise. It shows suppliers what share of its short-term obligations the manufacturer will be able to cover with its absolutely liquid assets.
Reference! Absolutely liquid assets include cash on hand and in a bank account, demand deposits, and other short-term financial investments. The main criterion is the ability to quickly convert (within a day) into cash.
Cash Ratio shows what percentage of its obligations the company is able to pay off in the short term, that is, it demonstrates its ability to pay for raw materials in cash.
If the current ratio is important for investors, the quick ratio is important for banks, then CR is of decisive importance for resource suppliers.
Formula for calculating the coefficient
The absolute liquidity ratio (Kabl) is a financial indicator that is calculated on the basis of information from the enterprise’s balance sheet - data on cash (item 1250), short-term investments (item 1240) and current liabilities (item 1500).
Cable = (DS + Kfi) / TO, where
Kab – absolute liquidity ratio;
Kfi – short-term financial investments;
DS – cash;
TO – current liabilities.
Analysts recommend subtracting estimated liabilities and future income from current liabilities. In this case, the balance calculation formula takes the following form:
Cable = (st. 1240 + st. 1250) / (st. 1500 – st. 1530 – st. 1540)
Master class: “An example of assessing liquidity ratios for OJSC Gazprom.” Example with conclusions
Summary
Analysis of balance sheet liquidity is an important task of the enterprise in terms of the state of assets and liabilities, as well as the ability to timely and fully pay off its obligations to borrowers. The higher the liquidity of the balance sheet, the higher the solvency of the company and the lower the risk of bankruptcy. When assessing the solvency of an enterprise, it is necessary to analyze the coefficients over time and in comparison with industry averages. This will identify possible threats to the risk of bankruptcy.
Author: Ph.D. Zhdanov Ivan Yurievich
Examples of indicator calculation
To understand what role Cable plays in assessing the short-term solvency of a company, you need to give examples of calculating the indicator.
Conclusion. has enough liquid assets to pay off current liabilities in the short term. It is capable of covering up to 30-40% of the claims put forward by creditors almost immediately. However, there is a downward trend in the indicator.
Figure 1. Dynamics of cables of PJSC Vympel Communications in 2014-2016.
The calculations made it possible to establish that the liquidity and solvency of a public corporation are maintained at a level sufficient for stable operation.
Conclusion! The public joint stock company "Novolipetsk Metallurgical Plant" ineffectively forms the structure of assets: there is an excessive amount of funds in the cash register, on the current account and in short-term investments, which makes them vulnerable to inflationary fluctuations. A particularly unfavorable value was observed in 2020: then the corporation could cover 120% of its current liabilities with highly liquid funds.
An example of analysis and assessment of the liquidity of an enterprise’s balance sheet
An example of a liquidity study of an organization will contain data from a real organization for three years of operation. We show the main parameters of the balance sheet in the table:
| Parameter | Page code. | 2016, billion rubles | 2015, billion rubles | 2014, billion rubles |
| Fixed assets | 1 100 | 270.6 | 298.3 | 315 |
| Having reserves of their own funds | 1 210 | 64.7 | 63.9 | 56.7 |
| VAT | 1 220 | 6.9 | 5.1 | 6.3 |
| Accounts receivable | 1 230 | 34 | 27 | 31 |
| Investments in financial instruments of the stock market | 1 240 | 3.1 | 26 | 13 |
| Cash and money in bank | 1 250 | 16.1 | 27 | 18.4 |
| Other current assets | 1 260 | 61 | 1 | 1.5 |
| Total current assets | 1 200 | 123.7 | 150 | 127 |
| Approximate amount of total assets | 394 | 448.8 | 442 | |
| Equity | 1 300 | 285.7 | 242 | 222 |
| long term duties | 1 400 | 43.9 | 103 | 129.8 |
| Short-term loans and borrowings | 1 510 | 19.5 | 65 | 48.6 |
| Trade debt | 1 520 | 43 | 37.6 | 41.5 |
| Total number of current liabilities | 1 500 | 64.7 | 103.6 | 90.5 |
| Total capital and liabilities rounded according to mathematical rules | 394.3 | 448.8 | 442 |
The next step in the analysis is to break down assets and liabilities into appropriate groups:
| Assets | 2016 | 2015 | 2014 | Comparison | Liabilities | 2016 | 2015 | 2014 | ||
| A1 | 19.2 | 53 | 31.3 | < | > | < | P1 | 43 | 37.7 | 41.4 |
| A2 | 33.9 | 27 | 31.4 | > | < | > | P2 | 21.7 | 65.9 | 49.1 |
| A1+A2 | 53.1 | 80.4 | 65.7 | < | < | < | P1+P2 | 64.7 | 103.6 | 90.5 |
| A3 | 70.7 | 70 | 64.4 | > | < | < | P3 | 43.9 | 103.2 | 129.8 |
| A4 | 270.6 | 298.3 | 314.9 | < | > | > | P4 | 285.8 | 242 | 221.7 |
According to the table, a positive ratio of A1 to P1 was observed only in 2020. This state of affairs suggests that the company is catastrophically short of funds to repay all existing debts at once. Analysis of the remaining time intervals shows that the amount of inventories and other resources of the enterprise is capable of repaying deferred debt.
Conclusion: the company is illiquid. However, over time, positive dynamics are observed, which, with proper subsidies, can bring the organization to self-sufficiency. After calculating all financial ratios, the following conclusions can be drawn:
- Over the three years of activity, serious progress is visible.
- The parameter of quick-liquidity funds in 2014 does not correspond to the norm.
- Optimal indicators of absolute liquidity are observed for 2014 and 2020.
- Positive dynamics suggest that the company has a chance of receiving full income.
Differences from current and urgent liquidity
The ratio differs from the mentioned indicators in the composition of assets that can be used to calculate current liabilities.
The key difference is hidden in the word absolute. It takes into account only the most liquid assets.
In contrast, the current ratio is equal to the ratio of all current assets to the amount of debt for a short period.
Calculating the value of short-term liquidity involves dividing the amount of highly and medium-liquid assets by the value of short-term liabilities.
The differences between the indicators are presented in the table.
| Coefficient | Absolute liquidity | Current liquidity | Urgent liquidity |
| Included assets | The most liquid assets, such as short-term financial investments, deposits and cash | All current assets | All assets with high and medium liquidity |
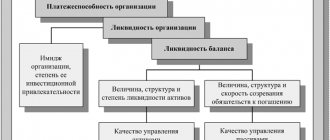
Absolute liquidity: concept
The term “liquidity” defines the company’s ability to cover debt to creditors with existing property. Absolute balance sheet liquidity is one of the indicators that establishes the levels of solvency and financial stability of a company. The higher the calculated liquidity value, the higher the rate of debt repayment; accordingly, low liquidity indicates the risk of bankruptcy.
When analyzing this indicator, assets are grouped according to the speed of their sale if necessary, and liabilities - according to the urgency of repayment. For example, property is divided into salable:
- Instantly (money and investments accumulated in section 2 of the balance sheet);
- Fast (accounts receivable for up to a year);
- Over a period of time (inventory);
- In the long term (non-current assets).
For the first three categories of assets belonging to working capital, indicators are calculated that assess the company’s ability to repay existing short-term debts, i.e. liquidity ratios.
Depending on the speed of transfer of property into money, three indicators are considered - absolute, current and critical liquidity. The absolute liquidity ratio shows what share of the existing short-term debt the company is able to repay in a short time using quickly salable property.
Factors influencing the dynamics of the indicator
An enterprise is a complex structure that consists of individual elements. It is constantly evolving under the influence of internal and external factors.
The indicator under study evaluates the ratio of highly liquid assets and short-term liabilities. From this it follows that its value is influenced by everything that determines their value.
Cash turnover is determined by the following:
- duration of the operation cycle;
- seasonality of business;
- terms of investment programs;
- operating leverage indicators;
- financial thinking of owners;
- situation on the commodity market;
- taxation;
- lending to suppliers and recipients;
- features of calculations;
- availability of loans and gratuitous financing.
By balance
A similar formula can be expressed using balance sheet lines:
Cal= p.1240 + p. 1250/s.1510 +s.1520+s.1530
The balance lines indicate the following:
- 1240 - financial investments;
- 1250 – cash;
- 1510 - borrowed funds;
- 1520- accounts payable;
- 1530 - deferred income.
Interpretation of the result
Analysis of the ratio allows you to assess the solvency of the organization, its problems and prospects.
To do this, some standards or regulations are required, which should be guided by when analyzing solvency.
Normative value
The optimal value is considered to be from 0.2 to 0.5. Other values indicate problems and necessary actions.
If below normal
It talks about the following problems and measures:
- if the value is below the standard range, the company is not able to pay obligations using its most liquid assets;
- if there is a shortage of the above assets, solvency should be analyzed more carefully;
- if the coefficient is 0, then this indicates an extremely critical state of liquid assets - they simply do not exist and the company cannot pay off its debts.
If above normal
An overestimated value of the indicator indicates:
- deviations in capital structure;
- irrational use of highly liquid assets;
- the need to study the use of capital.
What does his height indicate?
Growth indicates a change in the ratio of highly liquid assets and current liabilities in favor of the former.
More specific conclusions are drawn based on changes in the value of assets and liabilities. The company's solvency increases and its ability to make prompt payments increases.
If it has decreased, what does it mean?
A lower value of the indicator compared to the previous period indicates a decrease in funds that can be used to quickly resolve the problems of current debt. Other assets will be needed.
Balance sheet liquidity, grouping of balance sheet assets and liabilities
Let's consider the order of grouping Assets and Liabilities of the balance sheet of a Russian enterprise - Assets are arranged from most to least liquid, and the order of arrangement of Liabilities depends on the urgency of repaying the company's obligations:
| Grouping of Assets in the Balance Sheet | Grouping Liabilities in the Balance Sheet | ||
| A1 | Highly liquid (money, short-term investments) | P1 | The most urgent obligations (current accounts payable to counterparties, banks, employees, etc.) |
| A2 | Quickly realizable (short-term “receivables” - debts to the company, payments for which must be received no later than 1 year after the reporting date) | P2 | Medium-term liabilities (short-term loans and borrowings, reserves for future expenses, other short-term debts) |
| A3 | Slowly realized (current assets not included in groups A1, A2) | P3 | Long-term liabilities (liabilities taken from section IV “Long-term liabilities”) |
| A4 | Hard to sell (non-current assets – all) | P4 | Constant liabilities (company's own funds) |
According to the Balance Sheet, you can understand whether it is liquid by comparing the results for each of the groups of Assets and Liabilities. The following situation indicates absolute liquidity:
| Inequality | What does it mean |
| A1 > P1 | If you sell existing highly liquid assets, the company will be able to pay off its most short-term obligations. |
| A2 > P2 | After selling the company's quickly salable property, it will be possible to repay debts with an average repayment period. |
| A3 > P3 | With the proceeds from the sale of slowly selling assets, it is possible to pay off debts with a repayment period of more than 1 year. |
| A4 < P4 | The total value of an enterprise's hard-to-sell assets is less than the total amount of its equity capital. |