Any property or assets of an enterprise, expressed in both tangible and intangible form, are the active funds of the organization. In the balance sheet, the left side reflects the active part - it provides information about the property status of the organization. In fact, the active side of the balance sheet is the organization’s assets.
Read more: “What is an asset on the balance sheet”
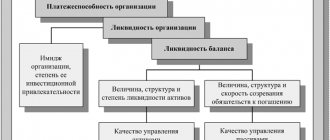
Ranking of assets by degree of liquidity and comparing them with liabilities
Theoretical economics divides assets, among other things, according to their degree of liquidity. In this way, assets are systematized depending on their ability to be quickly sold at a market price or another value close to it. The ranking of assets into four groups along with examples is presented in the table below.
| Most (highly) liquid assets (A1) | Quickly liquid assets (A2) | Slowly liquid assets (A3) | Hardly liquid assets (A4) |
| Implemented in the shortest possible time (money, financial investments) | Can be implemented quickly enough (short-term accounts receivable) | Slowly, over a long period of time, they are converted into money (finished products, raw materials, long-term receivables) | Can be implemented with difficulty, difficult (standardly these are non-current assets) |
In economic analysis, assets grouped in this way are compared with groups of liabilities, which are also divided into 4 groups. For your information, liabilities are all the financial sources from which money is received by the company. There are: P1 (most urgent liabilities), P2 (short-term), P3 (long-term) P4 (permanent) liabilities. Thus, group P1 includes tax debt, group P2 includes prepayments from partners, P3 includes deferred tax liabilities, and group P4 includes own capital.
The groups of assets and liabilities are subject to comparison: A1 and P1, A2 and P2, etc. The results of such comparisons may or may not correspond to generally established standards. Based on the correspondence or inequality, conclusions are drawn about the liquidity of the book. balance sheet and solvency of the enterprise. The standard recognizes:
- A1>P1;
- A2>P2;
- A3>P3;
- A4 < or = P4.
The ideal result of such comparisons is considered to be when, in fact, a correspondence is established for all four comparisons. Then we can talk about absolute liquidity.
As for the most liquid assets of the balance sheet (A1), they are always compared with the most urgent liabilities (P1). If it turns out that A1>P1, then this will mean that the company is able to pay off urgent debts in the shortest and medium term with the help of highly liquid assets.
Reflection in financial statements
Form No. 1 of financial statements - balance sheet, approved by Order of the Ministry of Finance of the Russian Federation No. 66n. In terms of structure, the active side of the balance sheet is a grouping of assets by degree of liquidity.
The report distributes assets incrementally. The least solvent assets come first. These are buildings, structures, other fixed assets, intangible assets - their conversion into money requires the greatest amount of time. The following asset groups are then reflected.
| Group name | Line in the balance sheet | Explanations for filling |
| A1 | The most liquid assets in the balance sheet are line 1240 + 1250. | The sum of the balance sheet indicators “Financial investments” and “cash”. Moreover, cash equivalents are included in the calculation, since they must be included in line 1250 when preparing the report. |
| A2 | 1210 + 1230 (short-term accounts receivable) + 1260. | Represents the total value of the line indicators:
|
| A3 | 1220 + 1230 (long-term accounts receivable). | Reflects the amount of long-term accounts payable, the repayment period of which exceeds 12 months. The calculation should also include the amount of refundable VAT claimed for deduction on purchased goods, works, and services. |
| A4 | 1100. | Total value of Art. 1110-1190. This is the value of all non-current assets of the enterprise at the reporting date. |
Learn more about which accounting indicators should be included in a specific line of the report: “We fill out reports in Form No. 1 Accounting Balance Sheet”
The most liquid assets (A1) according to accounting. balance sheet: composition, lines, calculation formula
In the bay. the balance sheet shows the assets presented as liquidity increases. The balance sheet itself does not indicate the degree of their liquidity (saleability). Therefore, we should proceed from what is included in the most liquid assets (A1) and which balance sheet lines correspond to them. In this regard, the following scheme for the composition of the most liquid assets of an enterprise (A1) will be relevant.
Deciphering “balance sheet” lines using a flowchart. Page 1250 is, literally, “Cash and cash equivalents”, page 1240 is “Financial investments” (meaning short-term). As for page 1250, in the second case, when we are talking about short-term financial investments, this line means only those investments that are classified as cash equivalents.
Thus, the most liquid assets are found in Section II (“Current Assets”). These are cash and cash equivalents, as well as financial investments (except for cash equivalents). Accordingly, A1 is the sum of cash and short-term investments. It follows that the formula for calculating A1 on the balance sheet will be as follows:
This is a standard formula used in the general case for A1 calculation. Below we will also consider typical general situations associated with A1. It should be noted that circumstances are different, sometimes even exceptional. Therefore, in practice, deviations from the general rules and norms are possible. In this regard, the following situation can be cited as a clear example.
Let's assume that an organization bought out receivables on favorable terms. The debtor (legal entity, organization) is obliged to pay it in 9.5 months, so it can be classified as a short-term financial investment. However, six months later the debtor went bankrupt. It is not known when the organization will receive the money now. Accordingly, these assets (according to the balance sheet - page 1240) can no longer be classified as the most liquid, since at this moment they have lost their once high liquidity.
Based on this example, we can conclude that A1 should include those money and short-term investments that are not encumbered with anything. They can also safely include demand deposits, short-term bonds (shares), which are admitted to trading and are included in the highest levels of copying lists.
What it is
Liquid assets are those that can be converted into cash in the shortest possible time and at the lowest cost. At the same time, money itself is included in this category. Their liquidity is close to 100%. They are the most liquid not only because their involvement in circulation requires a minimum of time, but also because they can be used at any time to carry out economic actions. Economic activities include selling, buying, satisfying the needs and desires of the population, and paying off debts.
Naturally, in addition to money, liquid assets include:
- Stock;
- Bonds;
- Short-term government securities values;
- Certain types of bills;
- Gold;
- Funds held in demand accounts;
- Various types of property that can be quickly sold if necessary.
You can also add to all of the above:
- Deposits in credit institutions;
- New and extended loans used to repay previously taken loans;
- Foreign or other currency received from a credit institution;
- Foreign currency with limited conversion;
- Cash held in correspondent accounts;
- Discounted bills and other bank debts with a 30-day maturity;
- Natural gems.
Liquid assets help maintain the bank's liquidity at the proper level. They can be implemented in the event of a crisis economic situation, as well as during a period of revival of business activity, in order to replenish loan funds.
Analysis of the financial stability of an enterprise using highly liquid assets A1
Highly liquid assets (A1), together with other groups of assets and liabilities, are involved in the calculation of several liquidity ratios. All this is done in order to analyze the financial stability of the enterprise, determine its liquidity and solvency.
As an example, we further propose to consider the procedure for calculating the main liquidity indicators of an enterprise. They are: the coefficient of urgent (KSL), current (KTL) and absolute (KAL) liquidity. In all cases, calculation is made on the basis of values taken from the accounting records. balance.
KTL is calculated in order to find out the ability of the enterprise to pay off current short-term obligations using exclusively current assets (see section II of the balance sheet). The optimal calculation result is considered to be KTL = 1.5 (maximum 2.5). A KTL value less than 1 signals a destabilization of the financial situation at the enterprise.
Calculation of CFL is needed in order to find out the financial capabilities of an enterprise in difficult situations. In particular, to determine whether it is able, with the help of A1 and A2, to pay off current obligations if difficulties arise with the sale of products, etc. The value of 0.7 is recognized as the normative value for KSL. This is a kind of minimum acceptable starting point. The best result is considered when KSL = 0.8 (up to 1.2).
KAL calculates in order to determine what share (part) of short-term debt the company will be able to repay in the near future. The standard value for KAL is 0.2. It indicates that the company is able to cover 20% of its urgent obligations every day. If CAL turns out to be lower (less than 0.2), then the financial situation can be called critical. This means that the company has low solvency and cannot pay its debts on time.
All of the above calculations use highly liquid assets, as evidenced by the presence of A1 in the formulas. To summarize, attention should also be focused on the fact that if highly liquid assets exceed all of the company’s liabilities, then this indicates its absolute financial solvency and stability.
Mini-rating of the most liquid assets
1st place is awarded to currency (both domestic and foreign). Currency is the most liquid asset. But do not forget that any currency can easily lose its liquidity in the event of inflation. To avoid this, you need to monitor the economic situation and timely transfer funds from one currency to another.
2nd place belongs to prime securities (government securities). In the stock market, liquidity is directly dependent on the number of transactions concluded involving these securities, as well as on the number of current offers related to their purchase and sale. Typically, securities traded on exchanges are considered more liquid than those traded on informal markets. The most liquid shares on the stock exchange are considered to be first-tier securities, while the rest are second-tier securities.
Precious metals take 3rd place. They could have taken a well-deserved second place in the ranking if not for such a key point as legislative restrictions on their free circulation. But despite this, certain metals (platinum, gold, silver and palladium) are classified as commodities. Their prices are set in the centers of world trade, New York and London. Potentially, such bars can be sold at any time, anywhere in the world, and, most importantly, with minimal losses and risk.
Example 1. Calculation of A1 amount as of December 31, 2018
Data for calculation are taken from accounting records. balance sheet of Tekhstroy LLC. A1 was calculated using the “balance sheet” formula (p. 1240 + p. 1250). The calculation results along with the indicators are shown in the table.
| Indicator and line name | Data on it as of December 21, 2018. (million Russian rubles) | Costing A1 |
| Page 1240. Cash and cash equivalents | 45 900 | |
| Page 1250. Short-term financial investments, as well as: | 35 700 | A1 (line 1240 + line 1250) = 45,900 + 35,700 = 81,600 |
| bank deposits | 30 000 | |
| loans issued | 5 700 |
It should be noted that when calculating A1, the total amount on line 1250 was used, which includes bank deposits and loans. That is, short-term investments (p. 1250) here are deposits + loans (30,000 + 5,700 = 35,700).
The resulting value of A1 (81,600) should be used when comparing A1 with P1, as well as when calculating liquidity indicators (KAL, KTL, KSL ratios).
Liquidity and financial stability analysis: what and why
Author’s version of the article by Irina Koltsova “Standards for liquidity, financial stability and independence for yours No. 4, 2011
Many people associate financial analysis with the tedious calculation of many ratios that poorly reflect the real processes occurring in the company. Indeed, if you consider 30–40 indicators from period to period with conclusions: “The current liquidity ratio decreased by 18% from 1.7 to 1.4 during the analyzed period, which corresponds to a drop of 0.3 points,” etc. , then there is no point in financial analysis.
Let’s try to understand, using the example of liquidity and financial stability indicators, why these indicators need to be calculated, and how to take a “non-standard” approach to understanding and using them.
Liquidity (current solvency) is the ability to pay obligations in full and on time. The most common indicators are net working capital (NWC) and current ratio (CR).
Net working capital, NWK - the difference between current assets and short-term liabilities.
NOL = Current assets - Current liabilities
It is necessary to maintain the financial stability of the company. A positive NER value serves as an indicator of the company's solvency for investors and creditors, and also indicates the possibility of expanding its activities in the future using internal reserves. A negative net working capital indicates an inability to repay all short-term obligations on a timely basis, because All current assets and part of non-current assets were financed through borrowed capital.
The optimal value of NSC depends on the industry, the scale of the enterprise, sales volume, turnover of fixed assets, and the economic situation in the country.
To determine the amount of NSC, the minimum required for a particular company, we follow the financial rule: the least liquid assets must be financed from our own funds. According to the generally accepted gradation in financial management, these include inventories of raw materials and work in progress. Hence:
Sufficient NER = Raw materials inventories + Work in progress
Comparing the actual value with a sufficient value will allow us to draw a conclusion about the sufficiency or insufficiency of own funds allocated to finance working capital.
Taking into account the individuality of the enterprise, we can proceed from the definition of “own” liquidity of assets. For example, in the food industry, products (flour, sugar, yeast, etc.) serve as raw materials; we will not call them illiquid assets, and, therefore, it is not necessary to “reserve” your own funds for them. And vice versa, if you look at the balance sheet of an aircraft manufacturing company (or any other company with a long production cycle), then a huge share of current assets will be occupied by the “Work in Progress” position, which will be 100% illiquid, and it is in the interests of the company to provide this asset with its own funds or long-term liabilities. In the event of a crisis, seemingly liquid “finished product inventories” for the metallurgical industry will be difficult to quickly sell at a normal price, and, therefore, they may receive the status of “least liquid current assets,” etc.
In some cases, it makes sense to determine the level of liquidity based on an understanding of the composition of the asset, the location of the enterprise, market conditions and other factors affecting the attractiveness and cost of current and fixed assets.
With the development of the company, the structure of the balance sheet may change, which imposes an obligation to periodically calculate the actual and sufficient value of NSC and compare them with each other.
A significant excess of net working capital over the optimal need for it indicates inefficient use of resources. Examples are: additional issue of shares or attraction of loans in excess of real needs for operating and investment activities, accumulation of funds due to the sale of fixed assets, irrational use of profits from core activities.
Often at enterprises the problem is exactly the opposite - negative NER or its insufficient value.
Negative PSC can be caused by:
- losses from core activities;
- investment costs exceeding one’s own financial capabilities (purchase of expensive fixed assets without prior accumulation of funds for these purposes);
- financing of investments through short-term loans;
- growth of bad accounts receivable;
- payment of dividends in the absence of corresponding profits;
- financial unpreparedness to repay long-term loans.
Let's look at the calculation of the actual and sufficient NER value using an example.
Tab. 1 : NER calculation
| 2008 | 2009 | 2010 | |
| ASSETS | |||
| Total non-current assets | 27000 | 44000 | 47000 |
| Stocks of raw materials and supplies | 3800 | 4300 | 4500 |
| Inventory in work in progress | 500 | 600 | 650 |
| Inventory in finished goods | 1200 | 1500 | 1650 |
| Accounts receivable | 5500 | 5800 | 6200 |
| Cash | 150 | 200 | 50 |
| Other current assets | 2300 | 1800 | 1850 |
| Total current assets | 13450 | 14200 | 14900 |
| PASSIVE | |||
| Total equity | 23400 | 26800 | 29800 |
| Total long-term liabilities | 9250 | 18200 | 17300 |
| Total current liabilities | 7800 | 13200 | 14800 |
| Actual net working capital | 5650 | 1000 | 100 |
| Increase in non-current assets | 0 | 17000 | 3000 |
| Increase in current assets | 0 | 750 | 700 |
| Increase in equity capital | 0 | 3400 | 3000 |
| Increase in long-term liabilities | 0 | 8950 | -900 |
| Increase in short-term liabilities | 0 | 5400 | 1600 |
| Increase in NER | 0 | -4650 | -900 |
| The cost of the least liquid part of current assets (inventories of raw materials and work in progress) | 4300 | 4900 | 5150 |
| Sufficient NER value | 4300 | 4900 | 5150 |
The decrease in net working capital in 2009 was associated with a large acquisition of non-current assets exceeding the increase in equity capital (due to earned profits reinvested in production) and attracted long-term loans; in 2010, the decrease was due to the repayment of a long-term loan, which affected the decrease in the solvency of the enterprise.
Let's analyze the situation taking into account the sufficiency/inadequacy of the NER value. In 2008, due to the excess of the actual value over the sufficient value, a “reserve for the level of equity capital” was observed. The “reserve” represented the possibility of accelerated growth of borrowed capital, which the company could allow without loss of financial stability and solvency. In our example, an increase in short-term liabilities within the range of 1350 (5650–4300) will not lead to a decrease in the company’s solvency. However, in subsequent years, the company exhausted this “reserve” and even exceeded the permissible NER value, which led to a decrease in financial stability due to the threatening growth of borrowed capital.
To increase net working capital and ensure a sufficient amount of PSC, it is necessary:
- Ensure the growth of profits reinvested in production;
- Finance the investment program with long-term loans (short-term loans should finance the increase in current assets!)
- Make investments within the limits of the profit received, attracted long-term loans, taking into account the value of the NER of the previous period (does the actual NER exceed its sufficient value - is there a “reserve”)
- Optimize the amount of inventory, work in progress, i.e. least liquid current assets.
To assess the short-term solvency of companies, the current liquidity ratio is widely used, defined as the ratio of current assets to the company's short-term liabilities.
In international practice, it ranges from 1 to 2, depending on the industry, and differs in different countries.
Tab. 2 Current ratio in international practice
| Industry | A country | |||
| USA | England | Japan | Europe | |
| Light industry | 2.5 | 1.8 | 1.8 | 1.8 |
| Food industry | 1.25 | 1.25 | 1.35 | 1.45 |
| Mechanical engineering | 1.1 | 1.1 | 1.2 | 1.5 |
| Trade | 1.6 | 1.3 | 1.1 | 1.0 |
| Average | 1.25 | 1.25 | 1.25 | 1.25 |
In Russia, the standard for this indicator is considered to be 2 (according to the methodology of the FSFO of the Russian Federation) or they refer to statistics on coefficients in industry directories.
In my opinion, comparison with statistical data is difficult both in the context of understanding how these statistics are formed, and taking into account the approach to comparison itself (by analogy with the average temperature in a hospital).
Therefore: 1) if you compare indicators, then based on your own calculations of similar indicators of competing companies or industry leaders. In this case, the calculation algorithm, the source of data and the purpose of the analysis are clear (for example, the desire to achieve the indicators of leaders). It is quite easy to find OJSC reports on websites; 2) collect statistics and pay attention to the dynamics of your odds.
The next task is to determine the acceptable value of the indicator for this particular company. To calculate the acceptable value of the current liquidity ratio, we will use the already announced rule of financial management: the least liquid current assets must be financed from our own funds.
Let's consider the algorithm for calculating a sufficient level of the current liquidity ratio:
1. Let's determine the least liquid part of current assets: inventories of raw materials and work in progress. This value corresponds to a sufficient amount of net working capital.
2. Let's calculate the permissible amount of short-term liabilities, guided by the following logic: we finance the least liquid current assets with our own funds, which means that liquid current assets can and should be financed with short-term liabilities.
3. Let us determine the sufficient current liquidity ratio:
Sufficient values of the current liquidity ratio must be compared with its actual values, on the basis of which a conclusion can be drawn about the sufficiency or insufficiency of the level of overall liquidity of the enterprise.
Tab. 3 calculation of current ratio
| 2008 | 2009 | 2010 | |
| The cost of the least liquid part of current assets (sufficient amount of NOC) | 4300 | 4900 | 5150 |
| Permissible amount of short-term liabilities | 9150 | 9300 | 9750 |
| Sufficient level of current ratio | 1,47 | 1,53 | 1,53 |
| Actual current ratio | 1,72 | 1,08 | 1,01 |
In none of the periods was the liquidity ratio lower than 2 for all three years. However, in 2008, the actual liquidity ratio exceeded the sufficient level of the company, which corresponds to the presence of a “reserve” in the amount of NWO and indicates an acceptable level of financial stability and solvency of the company. In subsequent periods, there is a noticeable decrease in the total liquidity ratio - from 1.72 to 1.01 and even going beyond the optimal level for a given company, which is a signal of a decrease in liquidity and the emergence of a critical situation. Such a decrease in the current liquidity ratio should attract attention and be noted, but the company’s position even in this situation can be considered acceptable, taking into account the positive value of NER and the reasons that caused the decrease in the indicator.
The reasons for the decrease in the current liquidity ratio echo the reasons for the decrease in the NER value, because the nature of these indicators is the same, namely:
- losses, and, as a consequence, a decrease in equity capital, i.e. an increase in the indicator comes down to an increase in the profitability of the activity and an increase in the share of profits remaining at the disposal of the enterprise (this is the case if the company earns enough, but prefers to pay dividends or withdraw funds to other companies rather than reinvesting them in the business);
- capital investments (purchase of fixed assets, construction of new production facilities, large-scale technical re-equipment, etc.) exceeding the amount of earned profit and attracted long-term loans will require the attraction of additional borrowed funds. To improve the liquidity ratio in this context, it is necessary to control the growth of borrowed funds, especially short-term loans;
- financing investments with “short-term” money (short-term loans) is the most common reason!!! When attracting short-term loans, the company must repay them in the short term. If short-term loans finance the need for working capital, this is usually associated with an increase in sales volumes, which provides additional profit, a source of debt repayment. Receiving additional profit through investments lasts for years (taking into account the payback period of investments), which means that in the short term the source of repayment of short-term obligations will not be enough, which imposes additional difficulties on the company in ensuring current solvency and refinancing.
A one-time calculated sufficient level of the current liquidity ratio is not a once and for all fixed benchmark for the company. He is authorized for a specific period characterized by certain working conditions. When the parameters of the company's activities change (the size of assets, profitability of activities, etc.), the sufficient level of liquidity ratios will also change. In this regard, it is advisable to calculate the total liquidity indicator acceptable for a given company for each analysis interval.
Gradually, the organization will be able to accumulate a statistical database of acceptable (optimal) values of the current liquidity ratio depending on operating conditions.
Continuing the topic of ensuring the financial stability of the company, it is necessary to understand how financially independent the company is from creditors, and what is its ability to repay not only current but also long-term obligations.
Financial independence/total solvency ratio (Equity to Total Assets)
The main guideline is ≥ 0.5, which corresponds to the understanding of the balance sheet structure as: the company’s equity capital must be at least 50%; in the case of a one-time presentation of bills to creditors for payment, the company, having sold assets, will pay off its liabilities.
But equity capital is invested in assets with varying degrees of liquidity, which means that the company’s ability to meet its obligations depends on the degree of liquidity of the assets. Consequently, here too it is necessary to take a “non-standard” approach to calculating the acceptable ratio of equity and debt capital, depending on the structure of assets.
The algorithm for calculating a sufficient value of the financial independence ratio is similar to calculating a sufficient liquidity ratio, only taking into account all the assets of the enterprise:
1. The level of financial stability in the long term is achieved if the condition is met: the least liquid assets must be financed from own funds, namely non-current assets + the least liquid current assets (inventories of raw materials and work in progress)
Equity capital required to ensure financial stability = least liquid assets that must be financed from own funds = Non-current assets + Inventories + Work in progress
2. A sufficient financial independence ratio is defined as the ratio of the required amount of equity capital to the actual value of the company's assets (balance sheet currency).
The calculated sufficient values of the financial independence ratio must be compared with the actual values, which will allow us to draw a conclusion about the sufficiency or insufficiency of the company’s level of financial stability. It is worth noting that it is interesting to control the difference between the actual and sufficient level of coefficients. If the actual value of the coefficients decreased, but the difference between the sufficient and actual values remained the same, the level of financial stability can be considered preserved.
Let's consider the calculation of the actual and sufficient financial independence ratio using an example.
Tab. 4: calculation of the financial independence ratio
| 2008 | 2009 | 2010 | |
| ASSETS | |||
| Total non-current assets | 27000 | 44000 | 47000 |
| Stocks of raw materials and supplies | 3800 | 4300 | 4500 |
| Inventory in work in progress | 500 | 600 | 650 |
| Inventory in finished goods | 1200 | 1500 | 1650 |
| Accounts receivable | 5500 | 5800 | 6200 |
| Cash | 150 | 200 | 50 |
| Other current assets | 2300 | 1800 | 1850 |
| Total current assets | 13450 | 14200 | 14900 |
| PASSIVE | |||
| Total equity | 23400 | 26800 | 29800 |
| Total long-term liabilities | 9250 | 18200 | 17300 |
| Total current liabilities | 7800 | 13200 | 14800 |
| Total balance currency | 40450 | 58200 | 61900 |
| Required amount of own funds (Non-current assets + least liquid current assets) | 31300 | 48900 | 52150 |
| Sufficient financial independence ratio | 0,77 | 0,84 | 0,84 |
| Actual financial independence ratio | 0,58 | 0,46 | 0,48 |
Calculation of the financial independence indicator showed that, as a rough approximation, in all three periods the financial independence coefficient corresponded to the standard of ≈ 0.5. However, the calculation of the required amount of equity, reflecting the least liquid assets, showed that the requirement for this ratio should be higher. At the level of 0.77–0.84, and in none of the analyzed periods the company achieved an indicator sufficient for it, which indicates the instability of its financial position and the potential loss of financial independence.
To find out ways to optimize the current situation, it is necessary to analyze the reasons for the decrease in the indicator of financial independence:
- losses, and, as a result, a reduction in equity capital;
- growth of assets (investments, working capital) exceeding the volume of profit received, which entails the attraction of additional borrowed capital.
In the example under consideration, a profit is earned, but it is not enough to finance the large-scale increase in non-current assets and the growing need for working capital. Analyzing the increase in non-current assets for the period under review by almost 2 times, the conclusion suggests itself that the company is making large investments comparable in scale to its existing activities. Most likely, the investment phase will end in the near future, new capacities will be put into operation, which will generate additional profits, which will be a source of repayment of long-term loans. Gradually, the loan will be repaid, the share of borrowed capital will decrease, and the indicator of financial independence will be restored to an acceptable value for this company. The main recommendation for reducing the debt burden in this example is to quickly reach the additional amount of profit planned for the new capacities.
The purpose of financial analysis is not just to calculate ratios, but to obtain information necessary for making management decisions! This means the task is to be able to obtain and use this information for operational and strategic planning of the company’s activities .
Liquidity indicators
The most important indicators include:
- absolute liquidity ratio. This is the ratio of highly liquid assets (cash and securities) to short-term liabilities as a percentage. This figure shows the proportion of debt that can be repaid over a specified period;
- adjusted liquidity ratio (or intermediate). Defined as the ratio of cash, accounts receivable and short-term investments to short-term liabilities. This shows the share of not only the debt that can be repaid with free finance, but also the expected income from work performed and products sold;
- current ratio (also called coverage ratio). The indicator is defined as the ratio of the “current assets” section of the balance sheet to short-term liabilities.
What is asset securitization
Asset securitization is a process of increasing the liquidity of assets in two ways:
- Transfer of assets to the balance sheet of a subsidiary or intermediary organization - Special Purpose Vehicle (SPV). In this case, a kind of assignment of claims under current obligations occurs.
- Issue of asset-backed securities.
The essence of the securitization process
So, what is securitization and why is it needed? Basically, this procedure is carried out for two purposes:
- reduction of illiquid assets;
- attracting additional working capital.
Next, we will consider the classification of this concept.
The degree of liquidity of organizations' assets
The transformation period as a leading indicator of the attribution of assets belonging to an enterprise makes it possible to subdivide assets according to the level of liquidity:
- The assets are absolutely liquid. Values that, as such, do not require implementation to participate in the economic activities of the company. These are ready-made means of making payments;
- Assets with a high degree of liquidity - funds with a monthly readiness period;
- Working capital in terms of liquidity is “average” - can be sold within six months;
- Enterprise funds that have potential with a short-term horizon of more than six months are classified as low-liquid.
Among the property of an enterprise there are always assets that are considered illiquid. It is not possible to implement them in their pure form. Therefore, the insertion of such property for sale is usually carried out as part of an industrial complex.
In order to arrange current assets in order of decreasing liquidity, specific assessment indicators are used in international practice. Ratios are calculated for current and quick types of liquidity. A normal value is two or higher (for current liquidity) and at least one for a quick indicator.
The assessment results for different industrial and service sectors are different. When analyzing financial and economic activities, enterprises usually rely on statistical data.
Similar articles
- Return on working capital: formula
- The ratio of current and non-current assets
- Working capital in the balance sheet, line
- Working capital turnover
- Classification of working capital of an enterprise