Hello, Vasily Zhdanov is here, in this article we will analyze the profitability of the enterprise. The profitability of an enterprise shows the efficiency of the enterprise and the optimal use of capital. Profitability analysis is carried out to assess the financial condition of the enterprise, identify growth reserves, and draw up long-term development plans for the company. Users of the information are credit institutions, founders, shareholders, partners and investors of companies.
The profitability indicator more accurately determines the level of stability and progressive development of the organization than the profit received by the enterprise from its activities. During the analysis process, the various economic components of the activity are assessed. The value of the indicator is influenced by the riskiness of doing business, external factors and internal operations that are subject to change. All areas of financial and economic activity are subject to assessment.
Analysis of the profitability of the organization's property
The profitability of an enterprise is an indicator of business activity in which income not only covers expenses, but also provides profit. The main parameter of a company's performance is return on assets. The indicator indicates the profit received for each ruble invested in assets.
When carrying out the analysis, the return on assets ratio (ROA) is used, calculated using the formula:
KRA = Pr x 100% / Ak; where Pr is the net profit of the enterprise remaining at the disposal of the company's owners, Ak is the book value of assets. In some cases, pre-tax profit data is used for analysis. When determining the value of assets, the average annual amount is used, calculated according to data at the beginning and end of the analyzed period.
To implement the formula based on reporting data, use data from Form 1 and Form 2 of the balance sheet (BB):
formulas and tables
Favorable and negative changes in the indicator data require detail in the analysis. The components of assets - fixed and working capital - are subject to assessment. For a detailed consideration of the coefficient, information from analytical accounting is used. Through analysis, it is determined whether the assets of the enterprise provide the required return. The asset valuation method is ineffective if the company operates seasonally.
The coefficient must have a value greater than zero. The parameter is often used in determining the amount of dividends on shares in a joint stock company. A high indicator indicates the availability of funds to pay dividends to the company's shareholders.
The task of asset analysis is to identify property that does not provide the required profitability. Based on the results of the analysis, the possibility of selling or leasing the property is determined. Growth is achieved by increasing the efficiency of using fixed and working capital. The positive dynamics of return on assets is also affected by an increase in capital turnover and sales profitability. The drop in profitability is compensated by an increase in turnover.
Calculation of profitability ratios.
Profitability ratios measure the profit earned by a company during an accounting period. Exhibit 15 provides definitions of common and most commonly used profitability measures.
Return on sales profitability ratios express various subtotals of the income statement (for example, gross, operating and net profit) as a percentage of revenue.
Essentially, these measures are part of the vertical percentage analysis of the income statement discussed earlier.
Investment profitability ratios measure profits relative to a company's assets, equity, or total capital.
Operating ROA (return on assets) ratio uses operating profit, which is earnings before interest on debt capital. In ROA and ROE, net profit is used as profit, that is, profit after deducting interest on borrowed capital.
In return on common stock, earnings are measured as net income minus preferred dividends (since preferred dividends are earnings attributable to preferred stock).
Illustration 15. Definitions of common and most commonly used profitability indicators.
| Profitability indicators | Numerator | Denominator | |
| Return on revenue (sales) | |||
| Gross profit margin | Gross profit margin (gross margin) | Gross profit | Revenue |
| Operating profit margin | Operating profit margin (operating margin) | Operating profit | Revenue |
| Pretax margin | Profit margin before tax | EBT (earnings before taxes but after interest) | Revenue |
| Net profit margin | Net profit margin (net profitability) | Net profit | Revenue |
| Return on Investment | |||
| Operating ROA | Operating return on assets | Operating profit | Average total assets |
| ROA | Return on assets | Net profit | Average total assets |
| Return on total capital | Return on Total Capital | EBIT | Average short-term and long-term debt and equity |
| ROE | Return on equity | Net profit | Average total capital |
| Return on common equity | Return on common share capital | Net profit - Dividends on preferred shares | Average ordinary share capital |
Notes:
- The term “sales” in the name of the coefficient is used as a synonym for revenue.
- Some financial analysts use EBIT as a quick proxy for operating income when calculating operating profit margin. Note that EBIT, strictly speaking, includes non-operating items such as dividends received and gains and losses on securities investments. It is extremely important that the analyst be consistent in the ratio formulas, both when comparing different companies and when analyzing the same company over different periods.
Return on Equity Analysis
The return on equity (ROE) parameter shows the profit received from the funds invested by the owners (shareholders). The identified data is taken into account in assessing the activities of joint stock companies and reflects the remuneration received by shareholders. The data is used when assessing stock quotes placed by a company on the stock exchange. The profitability ratio of the insurance company is determined by the ratio:
KSK = Pr x 100% / SK; where Pr is the company’s net profit, SK is equity capital. The coefficient is calculated according to data from Form 1 and Form 2 of the BB:
The KSC indicator is considered simultaneously with the KRA. Comparing the profitability ratios of the insurance company and assets allows us to identify the amount of borrowed funds in the common source of profitability. Features of SC increment:
- When comparing the profitability of the insurance company and all funds used in the activity, a difference is obtained that is recognized as the effect of financial leverage. The indicator indicates an increase in the profitability of the insurance company, obtained by attracting borrowed capital.
- Additionally, financial leverage is considered, indicating the share of loan funds in the total amount of sources.
- The analysis reveals the amount of borrowed capital that is optimal for use. In the case when, when using borrowed funds, the amount of profit received is greater than the interest on loans, attracting additional amounts is optimal. If interest on borrowed funds is accrued in an amount exceeding profit, lending is not profitable for the enterprise.
In most cases, provided that the profit exceeds the loan costs, the use of borrowed funds leads to an increase in the profitability of the insurance company. The conclusions about the efficiency of using the insurance company are influenced by the capital structure and the payback period (turnover) of assets.
Analysis of profitability of production activities
An assessment of the profitability of manufactured products shows the profit received from each unit of ruble invested in production. The investments spent on the production of products and their sales are taken into account. Depending on the goals set, the analysis may use data from full or production costs. The indicator is calculated for the enterprise as a whole and for individual types of items.
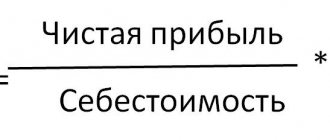
In calculating the coefficient, data from sales profit (in some cases - net profit) and the cost of production are used:
KRP = Prp x 100% / Srp; where Prp is profit from sales of products, Cpp is cost. To calculate the indicator, the data recorded in Form 1 BB is not used. When calculating, use information from Form 2 BB. Depending on the analysis conditions, various data are used:
- KRP for sales profit and production costs:
- KRP for net profit and production cost:
- KRP for sales profit and total cost:
- KRP for net profit and full cost:
Important! The indicator differs by industry. Data on the low value of the coefficient is used by the Federal Tax Service to schedule an on-site inspection.
If, upon comparison, the coefficient is lower than the industry average by more than 10%, an inspection of the control authorities is initiated in relation to the production enterprise. Information on industry average data is published on the official website of the Federal Tax Service.
Reasons for low profitability of activities (shortcomings in performance results).
To increase profitability, increase revenues and reduce costs. (Rentab = Revenue - costs)
1. Irrational use of performance results
- investment investments exceeding the Finnish enterprise capabilities
— irrational management of working capital
— unreasonable purchases of materials
— discrepancy between production plans and sales plans
- large work in progress with spacer plans malfunctioning
— unfavorable conditions for the supply of materials
2. Insufficient performance results
- low sales volumes, low demand for products, insufficient marketing efforts
- high production costs, unfavorable prices from suppliers, lack of cost control, production scale does not correspond to sales volumes - high level of fixed costs
— losses from other activities, fines, penalties, expenses for net profit of a non-productive nature
13. Methods for a comprehensive assessment of the financial condition of an organization.
Financial analysis is used to study economic processes and financial relations, shows the strengths and weaknesses of an enterprise and is used to make optimal management decisions.
Methods: - horizontal (temporal) analysis of data contained in the balance sheet. It is carried out on the basis of comparisons of the values of each balance sheet position for the reporting period with the value of this position for the previous period.
— vertical (structural) analysis of data contained in the balance sheet. It is based on the attribution of the values of each balance sheet position for the reporting period to the final balance sheet indicator - the balance sheet currency.
- trend analysis (Statistics - dependence is sought from a series of data) study of data contained in the organization’s balance sheets for the reporting period and a number of periods preceding the reporting period, in constructing the corresponding time series for each indicator (position) of the balance sheet and identifying general trends.
- analysis of financial ratios (the relationship between individual accounting indicators) - is based on determining the relationships between individual indicators (positions) of the balance sheet and the reporting forms attached to it, relating to the same period of time.
Of the many financial stability ratios, priority is given to the following indicators:
— coefficient autonomy (financial independence from external funding, looked at over time);
— coefficient ratio of borrowed and equity funds (financial leverage, those activities at the expense of the AP);
— coefficient financing (shows what part of the activities is financed by the SS).
— coefficient CC security (SOS, reflects what part is provided at the expense of CC and the availability of CC necessary for financial stability);
— coefficient maneuverability of the SS (what part of the SS is invested in the most mobile assets);
— debt ratio;
14. Types of financial results of the enterprise. Factors influencing financial results.
Financial results are the merit of the organization. Profit is the result of good performance or external objective and subjective factors, and loss is the result of poor performance or external negative factors.
For a more complete description of profit, it should be presented as both effective and quantitative indicators: effective - it reflects the effectiveness of available resources, the results of the organization’s activities; quantitative is the difference between the price and cost of a product, between sales volume and cost.
Factors:
- operating activities
- investment activities
- financial activities
15. Structure of financial ratios. Five basic groups used for express diagnostics of the financial condition of an organization. “Signal” coefficients for main groups. Algorithm for analyzing financial condition.
Savitskaya’s method (valid for agricultural enterprises)
By coefficient liquidity:
1.Coefficient absolute liquidity (Kal) - Shows what part of the current debt can be repaid in the time closest to the time of drawing up the balance sheet. K al = (DS+KFV)/KO, DS - cash, rub.; KFV - short-term financial. investments, rub.; KO - short-term liabilities, rub.
2. Coefficient. current (coverage, total) liquidity (Ktl) - Shows the extent to which current assets cover short-term liabilities. Ktl = OS/ KO , OS – working capital, rub.
3. Coefficient quick liquidity (KBL) - Shows the probability of repaying short-term obligations in the event of a serious crisis, based on the assumption that inventories will not be of any value. Kbl=(OS–W–VAT)/KO.
If at least one of K t.l. and Co. has a value below the standard, the coefficient of restoration of solvency is calculated for a period of 6 months.
3
Conditions for influencing product profitability
The increase in the indicator is influenced by several factors:
- Changing the product range of products. By reducing the proportion of low-profit or unprofitable types of items, the overall profitability of the enterprise increases.
- Reducing any component of the cost. Optimization is carried out for individual types or for the company as a whole.
- Increasing the average sales price of products due to a revision of the assortment or changes in marketing policy.
- Increasing turnover of sales of manufactured products.
When carrying out the analysis, the components of the cost are subject to assessment. Conclusions about the efficiency of production of a particular type of product make it possible to plan the assortment, remove unprofitable items from production, and seek opportunities for adjusting selling prices.
Analysis of the profitability of product sales
An indicator interrelated with the efficiency of product output is return on sales. The data serves as the most accurate source of information about the profit received from each ruble of product sales. The result obtained is recognized as a significant evaluation parameter when changing the pricing policy or the range of products sold.
For the calculation, data is taken on profit from sales of products or net profit, depending on the tasks set, and revenue excluding VAT and excise taxes (indirect taxes):
Krpr = Prp x 100% / Vrp; where KRpr is the sales profitability ratio, Prp is the profit from product sales, Vrp is revenue. When calculating the indicator, data from Form 2 BB is used:
The indicator is used as the main indicator of the efficiency of operating enterprises with a small amount of funds and investment capital. Analysis using the coefficient is carried out in dynamics, based on data from several periods. If parameters decrease over several periods, it is necessary to identify the reasons. Improving indicators will help avoid bankruptcy and loss of business.
An example of calculating KPR in dynamics. At the end of 2020, the company received revenue in the amount of 5,600 thousand rubles, profit from sales - 1,200 thousand rubles, for 2020 - 6,800 and 700 thousand rubles, respectively. When analyzing the indicators, the following are determined:
- For 2020: KRpr 1 = 1,200 x 100% / 5,600 = 21.43%
- For 2020: KRpr 2 = 700 x 100% / 6,800 = 10.29%
A comparison of the ratios for 2020 and 2020 shows that while revenue increased, return on sales decreased for the period.
Analysis of the financial condition and analysis of the profitability of the enterprise using the example of Sputnik LLC
The article discusses the concept of financial analysis and profitability, technical and economic indicators characterizing the financial condition of Sputnik LLC. Changes in indicators that occurred during the reporting period (2014–2015) and factors that influenced the profitability of the enterprise were identified.
Key words: business activity analysis (ABA), financial analysis, technical and economic indicators, profitability
Business activity analysis (ABA) is an important element in the production management system, an effective means of identifying intra-economic reserves, the basis for the development of scientifically based plans and management decisions [6]. An important place among all types of financial analysis is occupied by financial analysis, which can be characterized as the process of understanding the essence of the financial mechanism of functioning of business entities in order to evaluate and justify decisions of an investment and financial nature. At the enterprise level, it is carried out by financial services. External financial analysis is carried out by banks, auditing firms, investors, etc. [4, p. 14].
Assessing the financial condition of an enterprise is one of the most important aspects of its analysis, as it serves as a source of understanding the reliable position of the enterprise. Financial condition is influenced by many factors [5]. Financial analysis is the process of studying and assessing an enterprise to formulate the most rational decisions for its further development and understanding of its current state. Financial condition refers to the solvency of an enterprise. Table 1 examines the technical and economic indicators of the activities of Sputnik LLC in dynamics for 2014–2015, characterizing the financial condition of the enterprise.
Table 1
Analysis of the main technical and economic indicators of Sputnik LLC for 2014–2015 (in thousands of rubles)
| Index | 2014 | 2015 | Deviation (+; -) | |
| Absolute | Relative, (%) | |||
| 72113 | 129690 | +57577 | +79,8 |
| 35346 | 61613 | +26267 | +74,3 |
| 36767 | 68077 | +31310 | +85,2 |
| 3216 | 6015 | +2799 | +87,0 |
| 14422 | 24204 | +9782 | +67,8 |
| 19129 | 37858 | +18729 | +97,9 |
| 10941 | 15380 | +4439 | +40,6 |
| 2112 | 3195 | +1083 | +51,3 |
| 36898 | 69083 | +32185 | +87,2 |
| 69 | 96 | +27 | +39,1 |
| 87,1 | 112,6 | +25,5 | +29,3 |
| 22889 | 39641 | +16752 | +73,2 |
| 27,64 | 34,41 | +6,767 | +24,5 |
| 29180 | 31098 | +1918 | +6,6 |
| 182776 | 244862 | +62086 | +34,0 |
| 2,47 | 4,17 | +1,69 | +68,8 |
| 3,9 | 5,3 | +1,4 | +35,9 |
| 0,20 | 0,28 | +0,08 | +39,8 |
| 26,5 | 29,2 | +0,027 | +10,0 |
Based on the data obtained, the following conclusions can be drawn about the results of the enterprise. The revenue of the enterprise under study in 2020 compared to 2014 increased significantly by 57,577 thousand rubles or 79.8 percent. The increase in revenue was due to rising prices for work (services) and an increase in sales volume. The cost of sales for the year increased by 26,267 thousand rubles or 60.2 percent, which is associated with an increase in sales volume and an increase in the wage fund. The increase in cost is ensured by an increase in the cost of materials for performing work (providing services) by the enterprise, as well as an increase in prices for all resources used by the enterprise.
The excess of the growth in sales revenue over the increase in cost of sales resulted in an increase in gross profit from 36,767 thousand rubles to 68,077 thousand rubles, which amounted to 31,310 thousand rubles or 85.2 percent. The faster growth of revenue compared to cost is a positive indicator in the activity of the enterprise. An increase in gross profit and sales profit positively characterizes the normal activities of the enterprise.
Sales profit in 2020 compared to 2014 increased by 18,729 thousand rubles or 97.9 percent. The increase in sales profit was achieved due to faster growth in gross profit above the increase in selling and administrative expenses. Net profit for the period under study also tends to increase; over the year it increased by 32,185 thousand rubles or by 87.2 percent. An increase in net profit is a positive result of all activities of the enterprise. The average number of employees increased in 2020 by 27 people, the increase was due to an increase in the volume of work performed and services provided. Average monthly output increased in 2020 by 25.49 thousand rubles or 29.3 percent, the increase was due to an increase in revenue from the sale of work (services) produced. The annual wage fund increased by 16,752 thousand rubles or 73.2 percent. The annual wage fund increased at a higher rate compared to the growth in the number of employees, which indicates an increase in the average monthly wage of the company’s employees by 6.77 thousand rubles.
Due to the acquisition of additional equipment, the average annual cost of fixed assets increased by 1918 thousand rubles or 6.6 percent. Capital productivity in 2020 compared to 2014 increased by 1.7 rubles - this means that every ruble invested in fixed assets brought the company 1.7 rubles more revenue than in the previous year. In general, the production activities of the enterprise are effective, the enterprise has a profit that is growing at a faster rate than its cost. The ratio of the three performance indicators of Sputnik LLC should have the following “Golden Rule” ratio:
100 %
where Tc is the rate of change of the company’s assets; Tr is the rate of change in sales volume; Tp is the rate of change in profit.
When examining the sustainability of economic growth rates at the enterprise, the ratio took on the following form: 100%
The ratio characterizes the cost savings of the enterprise and the increase in sales efficiency, as indicated by the increase in sales profitability from 26.5 to 29.2 percent. The ratio also characterizes the acceleration of asset turnover, that is, their profitability; for each invested ruble, the company received revenue of 5.3 rubles in 2020 instead of 3.9 rubles in 2014. In general, the Sputnik LLC enterprise is profitable, there is a tendency towards improvement (growth) of key economic indicators, such as revenue, profit, profitability, which are prerequisites for the effective construction and production activities of the organization. Next, let's move on to assessing the profitability of Sputnik LLC.
Profitability is a relative indicator that determines the level of profitability of a business [1, p. 272]. Profitability is the use of funds in which the enterprise not only recovers its costs, but also makes a profit. A business is profitable if it generates profit [2, p. 304]. The level of return on capital is determined by such main factors as: the cost intensity of production, capital productivity of non-current assets, the number of turnover of current assets per year, revenue and other income per ruble of costs, price increases (i.e. inflation) [1, p. 174]. Analysis of profitability indicators makes it possible to analyze the activities of an enterprise, identify the potential for growth in its effectiveness and develop a system of measures to use this potential, determine the effective use of material, financial and labor resources [3, p. 77]. Consequently, profitability indicators are the most generalized parameters of the productivity of an enterprise. Table 2 presents the procedure for calculating profitability indicators based on financial statements.
table 2
The procedure for calculating profitability indicators based on financial statements
Table 3 presents an assessment of the profitability of the enterprise under study.
Table 3
Assessment of profitability indicators of Sputnik LLC for 2015
| Index | Calculation formula | Economic content of the indicator |
| Return on investment from the enterprise's perspective, % | ||
| Return on assets | line 2400+line 2330*(1–0.20) 0.5 (line 1700 n.g.+line 1700 k.g.) | Orders the amount of net profit and interest after taxes attributable to each ruble invested in the assets of the organization. |
| Return on invested capital | line 2400+line 2330*(1–0.20) p.1700-(p.1500-p.1530) | Characterizes the profitability of long-term capital after taxes. Reflects the amount of net profit of the organization + interest payable for each ruble of long-term investments. |
| Return on investment from the perspective of enterprise owners, % | ||
| Return on equity | Shows how many rubles of net profit account for one ruble of the company’s equity capital | |
| Gross profit margin | page 2100 page 2110 | What part of each ruble of sales revenue is gross profit? |
| Operating profit margin | page 2200 page 2110 | What part of each ruble of sales revenue is operating profit? |
| Net profit margin | page 2400 page 2110 | What part of each ruble of sales revenue is profit? |
| Index | year 2014 | 2015 | Changes (+;-) |
| Return on investment from the enterprise's perspective, % | |||
| Return on assets | 24,66 | 51,48 | +26,82 |
| Return on invested capital | 49,76 | 36,43 | -13,33 |
| Return on investment from the perspective of enterprise owners, % | |||
| Return on equity | 45,97 | 10,49 | -35,48 |
| Return on sales, % | |||
| Gross profit margin | 50,99 | 52,49 | +1,50 |
| Operating profit margin | 26,53 | 29,19 | +2,66 |
| Net profit margin | 51,17 | 53,26 | +2,09 |
From the data in Table 2 it can be seen that the return on assets at the enterprise Sputnik LLC in 2020 compared to 2014 increased by 26.82 percent in absolute deviation, this suggests that net profit, taking into account interest payable in 2020, by 26.82 percent more than in 2014. In 2020, compared to 2014, return on equity decreased by 35.48 percent, which indicates a decrease in net profit by 35.48 rubles for every 100 rubles of equity. The gross profit rate in 2020 increased by 1.5 percent due to the fact that the growth rate of revenue outpaces the growth rate of cost of sales and shows that in 2020, 1.5 rubles of gross profit were received from every 100 rubles of sales of work (services). The operating profit rate in 2020 compared to 2014 increased by 2.66 percent, this was due to the fact that the growth rate of revenue outpaced the growth rate of direct and indirect costs, an increase in operating profit by 2.66 rubles for every hundred rubles of work completed (services). Also in 2020, compared to 2014, the net profit rate increased by 2.09 percent, this is due to the fact that the growth rate of income outpaced the growth rate of expenses of Sputnik LLC, therefore, in 2020, 2.09 rubles in profit were received from every hundred rubles of product sales.
The positive dynamics of profitability of sales indicates that Sputnik LLC is implementing a cost management process. In general, the Sputnik LLC enterprise is profitable, there is a tendency towards improvement (growth) of key economic indicators, such as revenue, profit, profitability, which are prerequisites for the effective construction and production activities of the organization.
Literature:
- Grigoriev Yu. A. Analysis of production and commercial activities of the enterprise / Yu. A. Grigoriev. - M.: Book World, 2002. - 194 p.
- Kovalev V.V. Financial reporting. Analysis of financial statements (basics of balance sheet): textbook / V.V. Kovalev, Vit. V. Kovalev. — 2nd ed., revised. and additional - M.: TK Welby, Prospekt Publishing House, 2006. - 432 p.
- Problems of economics and management of enterprises, industries, complexes: monograph. Book 30 / E. N. Volk, B. Dauletbakov, E. V. Dzhamai and others / Under the general. ed. S. S. Chernova. - Novosibirsk: Publishing House TsRNS, 2020. - 220 p.
- Savitskaya G.V. Analysis of the economic activity of an enterprise: textbook / G.V. Savitskaya. — 5th ed., revised. and additional - M.: INFRA-M, 2009. - 536 p.
- Tsareva N. A. Assessing the needs and potential of regional small and medium-sized businesses in the field of international and interregional cooperation: based on materials from a sociological study conducted in the Primorsky Territory // Economics and Entrepreneurship. — 2020. — No. 1 (54). — pp. 981–987.
- Shestak O.I. Strategic approach to the development of small and medium-sized businesses at the regional level (on the example of the Primorsky Territory) // Economics and management of management systems. — 2020. — No. 3.1. — pp. 183–196.
Influencing factors considered in detailed analysis
The following factors influence the increase in sales profitability:
- An increase in revenue while outstripping the growth of costs and expenses for selling products. The process is caused by a change in the range (nomenclature) of products sold. It is recognized as a favorable factor in the development of the enterprise.
- Decrease in the growth rate of costs, outpacing the decrease in revenue. Despite the increase in profitability, the factor is negative, showing a decrease in sales volume. You can prevent the fall by conducting marketing campaigns, advertising, introducing discounts and bonus programs.
- Changing the sales mix towards highly profitable products. After identifying slow-moving items, the share of profitable products in the assortment is increased. Profitability assessment is carried out using the chain substitution method.
- Reducing production costs and other related costs of the enterprise.
- Increase in sales prices while maintaining the cost value.
There are internal and external factors. Internal mechanisms of influence depend on pricing policies, production organization, and cost optimization. Factors are subject to regulation based on data obtained as a result of the analysis.
External conditions are determined by the market demand for the company's products. The presence of competition, the price level for similar products in the segment, tariffs for transportation, utilities, and the presence of consumer demand are taken into account. External factors do not depend on the actions of company employees. A decrease in profitability indicates a decrease in the competitiveness of products and consumer demand.
Factors that determine business performance
The level of business profitability indicates the cost efficiency and prospects of the enterprise. In addition to external conditions, profitability directly depends on internal factors, such as labor productivity, equipment, and production organization. The cost of the final product is reflected in changes in the range and price of products. To increase profitability, enterprises are recommended to increase product prices, intensify trade turnover and reduce production costs.
In general, the profitability indicator is influenced by over 30 factors that must be taken into account when determining this indicator. When calculating, you should remember the capital intensity of the enterprise, its market share, labor productivity, and product quality.
Without assessing profitability, it is impossible to draw up a business plan or adequately assess the effectiveness of an existing business.
Conclusions obtained after assessing reporting data
| Estimated profitability of indicators | Calculation scheme | Conditions influencing efficiency |
| Assets | Ratio of profit to book value of assets | The coefficient expresses the amount of profit per 1 ruble of investment in assets |
| Own capital | Defined as the share of profit received per unit of funds invested in the insurance company | Characterizes the efficiency and profitability of using SC |
| Products used in evaluating new ones and making decisions on discontinuing existing types of items | The ratio of profit from product sales to total or production cost | The indicator is used when studying the profitability of certain types of items, to control profitability and pricing policy |
| Sales, interconnected with product analysis | The share of profit received per unit of ruble of sales revenue is determined | An increase in the indicator indicates an increase in sales prices or a decrease in fixed costs |