Management reports, their purpose
Distinctive features of management reporting from conventional accounting
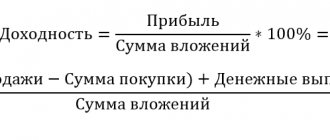
Financial analysis and planning based on management reports
It was always necessary to generate management reports; the term “managerial” was simply not applied to such internal reports.
Management reporting is a set of internal reports of an enterprise that are generated on a voluntary basis. The main purpose of their compilation is to obtain reliable information about the state of affairs of the enterprise on a specific date, for example, to provide management or owners of the enterprise.
The legislation of the Russian Federation does not provide for unified forms of management reporting due to the voluntariness of its formation, therefore each enterprise has the right to independently develop reporting forms. As a rule, the usual forms of financial statements are taken as a basis.
The main difference between accounting and management reporting is the recipient, the end user. Mandatory accounting reporting is necessary for managers - to analyze the activities of the enterprise for the past reporting period, for auditors and the tax service - to verify the correctness of the reflection of the facts of activity.
Voluntary management reporting is necessary exclusively for the head of the enterprise, his deputies or other authorized persons (management personnel and managers, for example), as well as for the owners of the enterprise to analyze the operation of the enterprise and plan further activities in the short or long term.
In addition, accounting reports are compiled for the enterprise as a whole, and management reporting, if necessary, is presented in the context of structural divisions, separate divisions, subsidiaries, etc. Such detail allows us to identify problem areas.
Note!
Experts in the preparation of management reporting note that you should not overload reports with information, otherwise the document will be difficult to perceive.
The frequency and composition of management reporting depends solely on the requirements of end users (for example, management). Reports can be generated daily, weekly, monthly, quarterly and annually.
As a rule, management reports include planned and actual indicators. This allows you to carry out plan-fact analysis and calculate relative coefficients characterizing the efficiency of financial and economic activities.
This is not a complete list of reports that can be included in management reporting. Let us repeat that the purpose and content of reports directly depend on the requirements of the recipients. Therefore, the following secondary management reports can be generated:
- on the actual cost of production in comparison with planned indicators;
- on the execution of the production plan;
- execution of the marketing plan;
- for work in progress;
- on stocks of raw materials and finished products;
- about accounts receivable;
- about accounts payable, etc.
Income statement
This is perhaps the most important management report. It reflects information about the actual profit/loss of the enterprise.
The form of the financial results report (form No. 2) of the financial statements was approved by Order of the Ministry of Finance of Russia dated July 2, 2010 No. 66n (as amended on April 6, 2015) “On the forms of financial statements of organizations” and has a fairly detailed form.
In a management report, it is permissible to both group some lines of the report and, conversely, provide a more detailed breakdown (primarily this concerns the company’s expenses).
The final recipients of the document can also request detailed information on revenue (for example, broken down by type of product).
A fragment of the management report on financial results is in table. 1.
Table 1
Fragment of the management report on financial results, thousand rubles.
| Name | Meaning |
| Revenue | 68 074 |
| Cost of sales | 56 616 |
| Gross profit (loss) | 11 458 |
| Profit (loss) from sales | 11 458 |
| Percentage to be paid | 362 |
| other expenses | 1018 |
| Profit (loss) before tax | 10 078 |
| Current income tax | 2016 |
| Net income (loss) | 8062 |
The main thing we see from this report is the positive financial result of the enterprise: revenue exceeds the costs the enterprise incurred to produce and sell products.
However, every company constantly strives to increase profits. To do this, as a rule:
- increase the selling price per unit of production (which, as a consequence, increases the amount of revenue);
- reduce the cost of sales (with a constant amount of revenue, this increases profit, including profit per unit of production).
When planning financial results based on management reporting, actual and planned sales volumes are taken into account. Such planning is quite conditional, since the cost of sales includes both fixed and variable costs, and the former practically do not change with an increase or decrease in sales volume.
We will carry out preliminary calculations to draw up a planned report on financial results.
We know that revenue in the amount of 68,074 thousand rubles. received from sales of 257 units. products at a price of RUB 264,880.00. per unit (the analyzed enterprise produces one type of product).
In the next reporting period, it is planned to sell 294 units.
Thus, the planned revenue will be 77,875 thousand rubles. (RUB 264,880.00 × 294 pcs.) at a cost of RUB 64,767 thousand. (RUB 220,295.70 × 294 pcs.).
Forecast report on financial results - in table. 2.
table 2
Forecast report on financial results, thousand rubles.
| Name | Meaning |
| Revenue | 77 875 |
| Cost of sales | 64 767 |
| Gross profit (loss) | 13 108 |
| Profit (loss) from sales | 13 108 |
| Percentage to be paid | 362 |
| other expenses | 1018 |
| Profit (loss) before tax | 11 728 |
| Current income tax | 2346 |
| Net income (loss) | 9382 |
With such planning, profitability indicators (products, enterprise, sales, etc.) remain unchanged, because forecasting takes into account only fluctuations in sales volume.
Let's calculate the main profitability indicators that characterize the profitability of the enterprise and the economic feasibility of its activities.
Profitability of core activities (R1) is the ratio of profit before tax to revenue from product sales. This ratio shows what part profit is in revenue.
Conventionally, the normative value is considered to be 10–15%.
In our case, R1 = 10,078 / 68,074 × 100% = 11,728 / 77,875 × 100% = 15%.
The higher the profit margin in relation to revenue, the more profitable the enterprise is considered.
Product profitability (R2) is the ratio of net profit to total cost. This indicator is very important for analyzing the efficiency of activities: it shows how profitable the products produced are, how much profit the enterprise received from the total costs of its production.
In our case, R2 = 8062 / 56,616 × 100% = 9382 / 64,767 × 100% = 15%.
For your information
At the stage of analyzing management reporting and planning activities in the short or long term, it is possible to identify problem areas, such as high enterprise costs for production, low revenue, etc.
Based on the results of the analysis, they formulate a policy for the further development of the enterprise, make decisions, for example, on abandoning the production of any type of product, on expanding the sales market, optimizing costs, increasing/lowering the retail price, etc.
Stages of developing a management reporting system at an enterprise
Financial indicators are the most accurate determining parameter of the success or loss of a company, regardless of the volume and direction of its activities. For development and competent management, constant monitoring of the movement of monetary assets is required. Therefore, even the most modest enterprise comes to the need to create a reporting system and uses various forms of presenting performance indicators. The implementation of a certain scheme requires considerable effort, concentration in calculations and time, but the further result is worth it.
Modern technologies make it possible to use ready-made programs to solve problems electronically. This method is especially relevant for organizations with many divisions, when consolidation of reporting and processing of a wide range of information is required. To apply any management accounting option, it is wise to adhere to the main stages of development and creation:
- Drawing up a list of tasks that planned reporting should solve.
It is important to understand exactly what purpose each document serves. Extra paperwork that takes time and is not relevant will constantly distract from real problems or duplicate information. Specific goals will help identify the most important aspects for management and the necessary items for data collection.
- Determination and specification of the list of indicators necessary for the analysis of financial activities in each division.
Here the main task is to highlight the items and subitems of expenses and income, on the basis of which the analysis of work will be carried out. Each department may have its own list based on the specifics of the work. The main condition is that the reporting document must logically correspond to the direction of the department. For example, a report for the sales department should show the amount of sales, the number of new contracts, and the logistics department should show transport costs and supply volumes. Approval of a certain list is made by the head of the enterprise (division), based on the need for information for making management decisions.
- Establish the frequency of reporting for each type of indicator, based on the need for operational use of this data.
Determining the timing and frequency of preparation of management reports is based on the level of efficiency in applying the results obtained. As a rule, the main package of documents is required for monthly and (or) quarterly meetings to analyze the work done and set short-term plans. Weekly reports are usually generated by each organization individually and serve as a control tool. Trade organizations often work on this principle, using a KPI performance tracking system: a single file is kept for recording indicators for a calendar month, but data is collected and calculated on a weekly basis. This allows you to assess the level of implementation of plans in real time and take prompt measures to stimulate demand.
- Development and approval by company regulations of reporting forms and preparation deadlines.
It should be noted that the forms of documents for reporting to management should have a unified form for each type. This will solve many problems with the perception of information, its interpretation, and will also reduce the time for comparing data from different departments. It is for this purpose that the approved form of management reporting is included in the work regulations and is reflected in other administrative documents for the responsible position. Preparation deadlines should take into account the time required to process indicators and have realistically achievable limits. For example, if a report for the past month is required, then it is advisable to set a generation date no earlier than several days after the close of the past month according to accounting in order to obtain more reliable financial data.
Creating a clear, organized reporting system can be time consuming. The indicators and articles used at the initial stages may subsequently change constantly, depending on the relevance of their use.
During the development of additional forms of recording indicators, it is important to try to take into account the possibility of the emergence of unplanned expenses and additional items. The approved reporting form should be easily adapted to new criteria, so as not to take up time in the future for complete reformulation.
Managerial balance
The form of the management balance sheet is not approved at the legislative level, so we recommend using the form of the usual balance sheet.
For your information
Depending on the wishes of the end user, you can remove unnecessary balance sheet lines, group individual items or, conversely, describe them in detail (for example, borrowed funds, if their share in the balance sheet currency is significant).
An example of a managerial balance sheet is in table. 3.
Table 3
Management balance, thousand rubles.
| Assets | Meaning |
| I. Non-current assets | |
| Intangible assets | 3 |
| Fixed assets | 4803 |
| Total for Section I | 4806 |
| II. Current assets | |
| Reserves | 14 390 |
| Accounts receivable | 22 422 |
| Cash and cash equivalents | 4063 |
| Total for Section II | 40 875 |
| BALANCE | 45 681 |
| PASSIVE | |
| III. Capital and reserves | |
| Authorized capital | 86 |
| Reserve capital | 14 |
| Retained earnings (uncovered loss) | 10 942 |
| Total for Section III | 11 042 |
| IV. long term duties | 0 |
| Total for Section IV | 0 |
| V. Current liabilities | |
| Borrowed funds | 550 |
| Accounts payable | 34 089 |
| Total for Section V | 34 639 |
| BALANCE | 45 681 |
We made the usual form of the balance sheet simpler - we removed items with zero values, with the exception of section IV, in order to focus on the fact that the company has no long-term liabilities.
Based on the management balance sheet, the main indicators of the financial condition of the enterprise are calculated. At this stage, a comprehensive analysis of reporting is not needed - it is enough to focus on the problem areas of the enterprise:
The equity ratio (EFR) is calculated as the ratio of the difference between equity capital and non-current assets to current assets:
CMRR = (Total for Section III – Total for Section I) / Total for Section II,
in our example, CMRR = (11,042 – 4,806) / 40,875 = 0.15.
The value of the indicator indicates an unsatisfactory balance sheet structure and a high probability of insolvency of the enterprise as a whole.
An indicator value greater than 0.5 indicates the good financial condition of the enterprise and its ability to pursue an independent financial policy.
The debt ratio (Кз) is calculated as the ratio of the enterprise's total debts to its own funds:
Кз = (Total for Section IV + Total for Section V) / Total for Section III;
at the analyzed enterprise Kz = 34,639 / 11,042 = 3.14.
The standard value of the indicator is below 1. Otherwise, the amount of borrowed funds exceeds own funds.
Based on the results obtained, it is possible to predict the balance sheet model for the next reporting period, for example, using the percentage of sales method.
To compile it, you need the following data:
- about actual sales for the reporting period (for our example - 257 units), for which the management balance sheet was compiled;
- about the planned sales volume in the next period (for our example - 294 units).
The coefficient of change in sales volume (Kizm) is calculated as follows:
Kism = Q2 / Q1,
where Q1 is the volume of product sales for the previous period, pcs.;
Q2 - volume of product sales for the planned period, pcs.,
in our case Kiz = 294 / 257 = 1.144.
The amount of net profit according to the forecast (see Table 2) is 9382 thousand rubles. provided that the company will not distribute profits as dividends due to the high level of short-term liabilities that need to be repaid.
Net profit can be used, for example, to increase retained earnings (RUB 5,486 thousand) and to pay off liabilities (RUB 3,896 thousand).
Based on this methodology, we will draw up a forecast balance (Table 4).
Table 4
Forecast balance, thousand rubles.
| Assets | Meaning |
| I. Non-current assets | |
| Intangible assets | 3 |
| Fixed assets | 5495 |
| Total for Section I | 5498 |
| II. Current assets | |
| Reserves | 16 462 |
| Accounts receivable | 25 651 |
| Cash and cash equivalents | 4648 |
| Total for Section II | 46 761 |
| BALANCE | 52 259 |
| PASSIVE | |
| III. Capital and reserves | |
| Authorized capital | 86 |
| Reserve capital | 14 |
| Retained earnings (uncovered loss) | 16 428 |
| Total for Section III | 16 528 |
| IV. long term duties | 0 |
| Total for Section IV | 0 |
| V. Current liabilities | |
| Borrowed funds | 629 |
| Accounts payable | 35 102 |
| Total for Section V | 35 731 |
| BALANCE | 52 259 |
Based on the proposed changes, we will calculate the coefficients:
KOSS = (16,528 – 5,498) / 46,761 = 0.24;
Kz = 35,731 / 16,528 = 2.16.
So, thanks to the measures formed on the basis of management reporting, it was possible to increase the enterprise’s independence from borrowed sources of financing and improve the ratio of equity and borrowed funds.
To consolidate the effect, it is worth analyzing the profitability of the enterprise and finding an opportunity to increase the level of profit to strengthen financial independence.
Recommendations for preparing management reports in Excel
At each enterprise, depending on its line of activity, management reporting differs in form, content, and regularity of preparation. But there are general recommendations on how to create management reports in Excel faster and more accurately:
- Separate tables
Each table should be assigned a separate sheet and not try to fit all the indicators into one. This will greatly facilitate the search for the necessary information and the readability of the data, especially for detailed reports. - Sort data by category
Place source data for different categories of products or services on separate sheets, and on the first - a pivot table with total values. This format for presenting information will be clearer and more convenient for users. - Use directories
Business unit directories make your work much easier. With their help, you can significantly save time on compiling similar accounting tables by using auto-fill in cells. - Use the additional functionality of Excel
Do not neglect analytical functions - dispersion, correlation, mathematical and average expectation, extrapolation method and others. They will allow you to identify the main trends in business development and respond to them in a timely manner. - Create correction sheets
Make corrections on special correction sheets. Reports must be prepared according to a single standard without additional corrections by hand. - Create test cells
When transforming data, highlight test cells with color or another method. They will attract attention and help you not to miss mistakes. - Use the protection settings.
Control sheets of reporting forms must be protected from changes.
The most important advantages of the Excel program for management accounting are accessibility, the presence of the necessary set of functions for quickly processing data sets, and the ability to automate similar operations. A well-established accounting system will allow you to regularly conduct analytics on the actual state of affairs at the enterprise with minimal time and in a convenient format.
Hone your Excel knowledge and skills with our training on budgeting, macros, data visualization, basic tools and advanced features!
Excel for financier
Income and Expense Report
The income and expense report allows you to analyze the volume of cash flows, revenue from sales of products and costs of their production and sale, and calculate coefficients characterizing the business activity and financial stability of the enterprise.
First, the enterprise prepares a planning document on future income and expenses, and based on it, an actual management report. On its basis, planned and actual indicators are analyzed.
An example of an income and expense report is presented in table. 5.
Table 5
Management report on income and expenses
| No. | Name of income (expenses) | Plan | Fact |
| 1 | Income | 18 560,00 | 16 704,00 |
| 1.1 | Advance to Beta LLC | 7424,00 | 7424,00 |
| 1.2 | Advance payment to Gamma LLC | 2438,40 | 2438,40 |
| 1.3 | Advance to Omega LLC | 4985,60 | 4985,60 |
| 1.4 | Final settlement of Beta LLC | 1856,00 | 1856,00 |
| 1.5 | Final settlement of Gamma LLC | 609,60 | 0,00 |
| 1.6 | Final settlement of Omega LLC | 1246,40 | 0,00 |
| 2 | Expenses | 8434,77 | 8415,26 |
| 2.1 | Payment of wages + insurance premiums | 4007,34 | 4383,45 |
| 2.2 | Advance payment to supplier Norman LLC | 1582,45 | 1582,45 |
| 2.3 | Advance payment to supplier Dixit LLC | 1512,00 | 1512,00 |
| 2.4 | Final settlement with the supplier Norman LLC | 395,61 | 0,00 |
| 2.5 | Final settlement with the supplier Dixit LLC | 378,00 | 378,00 |
| 2.6 | Rent | 500,00 | 500,00 |
| 2.7 | Public utilities | 39,72 | 39,72 |
| 2.8 | Telephone and Internet expenses | 11,00 | 11,00 |
| 2.9 | Depreciation deductions | 8,64 | 8,64 |
When presenting management reports to management, you must be prepared to answer questions. For example, if there is no income - “why?” In this case, it is necessary to find out why the funds were not received - there were no shipments, the customer delayed payment, etc.
If the expense portion of the report has changed significantly, you may have to prepare a more detailed report for certain items.
An analysis of the income and expense report will allow you to understand in advance that in a certain period there will not be enough money in the account, for example, for advances to suppliers. Then management will have the opportunity to quickly respond to the situation, for example, agree to postpone the terms of the advance.
Naturally, such reports are constantly adjusted depending on changes in planned payments.
Can Excel spreadsheets cope with management accounting?
Management accounting is focused on providing the company's stakeholders with the information necessary to make effective strategic decisions. It is necessary to determine in advance the range of users of management reporting and their information needs. Among them may be managers, heads of structural divisions, CFO, general director, etc.
What distinguishes management reports from accounting reports:
- great detail
- other accounting methods
- use of special accounts
- high regularity of compilation
Purchasing or developing special software for management accounting is an expensive pleasure and not always justified. Therefore, small and medium-sized companies actively use Excel. It does not require additional financial costs and has sufficient functionality for preparing management reporting. Using mathematical, statistical, text, logic, and data analysis tools, professionals can calculate and organize data for reporting. In one of the articles, we discussed useful techniques for working in Excel for an accountant that may be useful for this.
Cash flow statement
The cash flow statement (CFS) contains information about cash flows (according to the current account and/or cash register), reflecting both planned and actual receipts and expenditures of funds.
The structure is similar to the cash flow budget (CFB), the distinctive feature is the presence of actual indicators characterizing the execution of the budget.
ODDS allows you to assess the financial capabilities of an enterprise, monitor the availability of funds in the account and in the cash register of the enterprise, balance the receipts and expenditures of funds, and therefore control the liquidity and solvency of the enterprise.
ODDS, like BDDS, includes cash flows from current investment and financial transactions.
Current cash flows are revenues from sales of products, rental payments, expenses for paying for the services of suppliers and contractors, wages for employees of the enterprise, tax payments, etc.
Investment cash flows are transactions associated with the acquisition, creation or disposal of non-current assets, for example, costs of development and technological work, loans, payments in connection with the acquisition of shares, etc.
Cash flows from financial transactions include proceeds from operations related to attracting financing (cash deposits, payments in connection with the repurchase of shares, payment of dividends, repayment of bills, etc.).
In order to effectively plan the expenditure and receipt of funds, it is necessary to conduct a plan-factual analysis, especially in a crisis situation, when payment discipline worsens and the enterprise may not have enough money to make payments.
Management ODDS increases the efficiency of planning and budgeting in general.
An example of a cash flow statement is presented in table. 6.
Table 6
Cash flow statement for July 2020, thousand rubles.
| No. | Index | Plan | Fact |
| Cash balance at the beginning of the month | 12 200,00 | 12 200,00 | |
| 1 | Cash receipts | 7400,00 | 7400,00 |
| 1.1 | Income from core activities | 7400,00 | 7400,00 |
| 1.1.1 | Advances from customers | 7400,00 | 7400,00 |
| 1.1.1.1 | Alpha LLC, agreement No. 12 dated January 30, 2017 | 0,00 | 0,00 |
| 1.1.1.2 | Gamma LLC, agreement No. 212/T dated June 28, 2017 | 7400,00 | 7400,00 |
| 1.1.1.3 | Beta LLC, agreement No. 17 dated March 24, 2017 | 0,00 | 0,00 |
| 1.1.2 | Revenue from sales of goods (works and services) | 0,00 | 0,00 |
| 1.1.2.1 | Alpha LLC, agreement No. 12 dated January 30, 2017 | 0,00 | 0,00 |
| 1.1.2.2 | Gamma LLC, agreement No. 212/T dated 04/28/2017 | 0,00 | 0,00 |
| 1.1.2.3 | Beta LLC, agreement No. 17 dated March 24, 2017 | 0,00 | 0,00 |
| 1.1.2.4 | Omega LLC, agreement No. 1 dated December 23, 2016 | 0,00 | 0,00 |
| 1.1.2.5 | Norma LLC, agreement No. 7 dated February 16, 2017 | 0,00 | 0,00 |
| 1.2 | Income from financial activities | 0,00 | 0,00 |
| 1.3 | Receipts from investment activities | 0,00 | 0,00 |
| 2 | Spending money | 7783,05 | 7517,01 |
| 2.1 | Expenses for core activities | 3647,65 | 3204,21 |
| 2.1.1 | Settlements with suppliers | 2319,05 | 1749,51 |
| 2.1.1.1 | Calculations for components | 2319,05 | 1749,51 |
| 2.1.1.1.1 | Product No. 1 | 1174,15 | 604,61 |
| 2.1.1.1.1.1 | Plant named after I. I. Ivanova | 0,00 | 0,00 |
| 2.1.1.1.1.2 | JSC "Alfa" | 268,85 | 0,00 |
| 2.1.1.1.1.3 | LLC "Diagonal" | 500,69 | 200,00 |
| 2.1.1.1.1.4 | JSC "Yaroslavl" | 0,00 | 0,00 |
| 2.1.1.1.1.5 | Other suppliers | 404,61 | 404,61 |
| 2.1.1.1.2 | Product No. 2 | 1144,90 | 1144,90 |
| 2.1.1.1.1.1 | Plant named after I. I. Ivanova | 0,00 | 0,00 |
| 2.1.1.1.1.2 | JSC "Alfa" | 588,00 | 588,00 |
| 2.1.1.1.1.3 | LLC "Diagonal" | 0,00 | 0,00 |
| 2.1.1.1.1.4 | Other suppliers | 556,90 | 556,90 |
| 2.1.2 | Salary | 1022,00 | 1119,00 |
| 2.1.2.1 | Division No. 1 (Moscow) | 476,00 | 512,00 |
| 2.1.2.2 | Division No. 2 (St. Petersburg) | 546,00 | 607,00 |
| 2.1.3 | Insurance premiums | 306,60 | 335,70 |
| 2.1.3.1 | Division No. 1 (Moscow) | 142,80 | 153,60 |
| 2.1.3.2 | Division No. 2 (St. Petersburg) | 163,80 | 182,10 |
| 2.2 | General running costs | 3068,00 | 3202,60 |
| 2.2.1 | Division No. 1 (Moscow) | 625,00 | 717,60 |
| 2.2.1.1 | Rent | 75,00 | 75,00 |
| 2.2.1.2. | Communication services | 3,00 | 3,00 |
| 2.2.1.3 | Security | 0,00 | 0,00 |
| 2.2.1.4 | Wages (account 26) | 340,00 | 412,00 |
| 2.2.1.5 | Insurance premiums (account 26) | 102,00 | 123,60 |
| 2.2.1.6 | Consumables, office equipment | 0,00 | 12,00 |
| 2.2.1.7 | Fare | 55,00 | 55,00 |
| 2.2.1.8 | other expenses | 50,00 | 37,00 |
| 2.2.2 | Division No. 2 (St. Petersburg) | 2443,00 | 2485,00 |
| 2.2.2.1 | Rent | 275,00 | 275,00 |
| 2.2.2.2 | Communication services | 15,00 | 17,00 |
| 2.2.2.3 | Security | 0,00 | 0,00 |
| 2.2.2.4 | Wages (account 26) | 1610,00 | 1670,00 |
| 2.2.2.5 | Insurance premiums (account 26) | 483,00 | 501,00 |
| 2.2.2.6 | Consumables, office equipment | 0,00 | 0,00 |
| 2.2.2.7 | Transport maintenance costs | 10,00 | 10,00 |
| 2.2.2.8 | other expenses | 50,00 | 12,00 |
| 2.3 | General production expenses | 1067,40 | 1110,20 |
| 2.3.1 | Division No. 1 (Moscow) | 361,90 | 369,20 |
| 2.3.1.1 | Wages (account 25) | 263,00 | 284,00 |
| 2.3.1.2 | Insurance premiums (account 25) | 78,90 | 85,20 |
| 2.3.1.3 | Tools, materials for industrial purposes | 10,00 | 0,00 |
| 2.3.1.4 | other expenses | 10,00 | 0,00 |
| 2.3.2 | Division No. 2 (St. Petersburg) | 705,50 | 741,00 |
| 2.3.2.1 | Wages (account 25) | 535,00 | 570,00 |
| 2.3.2.2 | Insurance premiums (account 25) | 160,50 | 171,00 |
| 2.3.2.3 | other expenses | 10,00 | 0,00 |
| 2.4 | Taxes | 0,00 | 0,00 |
| 2.4.1 | VAT | 0,00 | 0,00 |
| 2.4.2 | Income tax | 0,00 | 0,00 |
| 2.4.3 | Property tax | 0,00 | 0,00 |
| 2.5 | Expenses from financial activities | 0,00 | 0,00 |
| 2.6 | Expenses for investment activities | 0,00 | 0,00 |
| Cash flow from core activities | –383,05 | –117,01 | |
| Cash flow from financial activities | 0,00 | 0,00 | |
| Cash flow from investment activities | 0,00 | 0,00 | |
| Cash surplus/shortage at the end of the month | –383,05 | –117,01 | |
| Cash balance at the end of the month | 11 816,95 | 12 082,99 |
The first thing a manager or other end user of the ODDS will pay attention to is the negative value of the cash flow indicator.
For your information
Cash flow is a calculated indicator for each type of cash flow (current, financial and investment activities), representing the difference between cash receipts and expenditures.
A negative cash flow value indicates that cash receipts are lower than expenditures. And if the business had no cash balance from the previous month, it would not be able to make payments.
In the example, ODDS is presented broken down by manufactured products and separate divisions (Moscow and St. Petersburg). Management may require a more detailed breakdown, for example, if plans differ significantly from actuals.
Based on the cash flow, for example, for a month, cash flows for the next month are predicted, taking into account expected receipts.
Analysis of actual cash expenditures for a month allows you to classify expenses from the point of view of consistency and commitment, to form a certain “constant”, i.e., the amount of cash expenditure that is necessary monthly.
Based on the payment registers and payment calendars in terms of receipts of advances and final payments from customers, the revenue part of the ODDS is formed.
Such cash flow planning ensures efficient cash flow management.
Note!
Plan-actual analysis of the cash balance allows you to set a limit on the cash balance at the end of the month in order to ensure the solvency of the enterprise at the beginning of the next reporting month and in the event of insolvency of counterparties.
Report on the actual cost of production
One of the main tasks of each enterprise is to form a market price such that it covers the costs of producing the products sold, while being competitive, consistent with the quality of the products and ensuring market demand.
After a market or contract fixed price has been formed, it is necessary to try to maintain the cost - if the cost exceeds the price, the enterprise will not make a profit. You can control the situation using a management report on the actual cost of production (Table 7).
Table 7
Report on the actual cost of production, rub.
| No. | Costing item | Plan | Fact | Changes, +/– |
| 1 | Material costs | 54 000,00 | 54 361,00 | 361,00 |
| 2 | Labor costs for key production workers | 74 000,00 | 74 254,00 | 254,00 |
| 3 | Insurance premiums | 22 200,00 | 22 276,20 | 76,20 |
| 4 | General production expenses | 27 000,00 | 27 761,80 | 761,80 |
| 5 | General running costs | 41 000,00 | 41 642,70 | 642,70 |
| 6 | Production cost | 218 200,00 | 220 295,70 | 2095,70 |
| 7 | Non-production expenses | 0,00 | 0,00 | 0,00 |
| 8 | Full cost | 218 200,00 | 220 295,70 | 2095,70 |
| 9 | Profit | 46 680,00 | 44 584,30 | –2095,70 |
| 10 | Price excluding VAT | 264 880,00 | 264 880,00 | 0,00 |
This report reflects deviations of planned costing indicators from actual ones. And if they are significant, additional analysis is needed to determine the reasons.
As a rule, at this stage of compiling management reporting, they also establish a group of costs that have the largest share in the cost structure and, on the basis of this, formulate a cost reduction policy to increase product profitability. For example, in order to reduce material costs, they renegotiate contracts with suppliers on more favorable terms or look for new ones; in order to reduce the wage fund, they reduce the number of workers, attract third-party organizations to carry out work, etc.
Taking into account measures to optimize the cost structure, an updated structure is planned for the next reporting period.
Let's consider an example of drawing up a planned calculation of the cost of production, taking into account the growth in volumes while maintaining general business expenses (as a constant component of the cost structure, regardless of fluctuations in volume) at the same level (Table 8).
Actual general business expenses per unit of production (see Table 7) - 41,642.70 rubles. with a sales volume of 257 units. products in the reporting period. Consequently, the total amount of general business expenses is RUB 10,702,173.90. (RUB 41,642.70 × 257 pcs.).
The planned sales volume for the next reporting period is 294 units. Let us divide the total amount of general business expenses (RUB 10,702,173.90) by the planned volume, and we obtain specific general business expenses per unit of production (RUB 36,401.95).
The remaining cost items are accepted for the planning period unchanged according to the actual data of the cost report.
Table 8
Planning the cost structure taking into account the proposed measures, rub.
| No. | Name of calculation items | Fact | Plan | Changes, +/– |
| 1 | Material costs | 54 361,00 | 54 361,00 | 0,00 |
| 2 | Labor costs for key production workers | 74 254,00 | 74 254,00 | 0,00 |
| 3 | Insurance premiums | 22 276,20 | 22 276,20 | 0,00 |
| 4 | General production expenses | 27 761,80 | 27 761,80 | 0,00 |
| 5 | General running costs | 41 642,70 | 36 401,95 | 5240,75 |
| 6 | Production cost | 220 295,70 | 215 054,95 | 5240,75 |
| 7 | Non-production expenses | 0,00 | 0,00 | 0,00 |
| 8 | Full cost | 220 295,70 | 215 054,95 | 5240,75 |
| 9 | Profit | 44 584,30 | 49 825,05 | 5240,75 |
| 10 | Price excluding VAT | 264 880,00 | 264 880,00 | 0,00 |
We left unchanged all cost items included in the cost price, with the exception of general business expenses, which conditionally do not change depending on the growth of sales volumes.
Thanks to optimization, the planned specific profit per unit of production, while maintaining the retail price at the same level, will be increased by 5,240.75 rubles, by the total forecast sales volume - 1,540,780.50 rubles.
If no measures are planned to optimize costs, the planned cost structure, as a rule, includes actual data for the previous period.
What is management reporting and what is it used for?
Enterprise management is a continuous process, the essence of which is influencing an object in order to stabilize, control or change it in accordance with business objectives. Another management function is the rational use of the company’s workforce and resources to increase profitability.
To keep a business efficient and competitive, managers must make certain decisions all the time. These decisions are based on current information about the affairs of the enterprise. This is exactly the information that management reporting (MA) provides to management.
Management reporting is a company’s internal control tool and a way to assess its economic prospects.
Unlike financial reporting, no one obliges you to prepare management reporting. But managers need it to effectively manage their business. The MA contains information about all structural divisions of the enterprise.
It can be argued that a competent manager is able to evaluate economic indicators based on accounting records. This is partly true, but accounting does not reveal all the nuances of the enterprise.
It is difficult to understand from accounting reports which products are in high demand and which are the opposite. Management accounting shows a more clear picture.
Example
expanded its product range last year. With the help of management reporting, which the executive director proposed to introduce at the enterprise, management found out that the products “Family Dumplings” and “Village Sausage” are in greatest demand. We decided to increase the production of these items.
The MA also showed that purchasing packaging materials from suppliers is less profitable than making them yourself. The director decided to open a new workshop for the production of his own packaging.
Reporting is needed by economical, far-sighted and prudent owners who want to make a profit not only by increasing production volumes, but also by increasing labor productivity, as well as reducing unnecessary expenses. This is an integral part of competent budgeting in an enterprise.
Who is the customer of management reporting? TOP managers and line managers - production directors, financial directors, sales managers, etc.
To compile a document, various forms are used, most often tables, graphs, and diagrams.
The information should be:
- reliable - reflect real processes without any additions or manipulations;
- targeted – addressed to specific users, for example, the general director;
- confidential - there is no need for outsiders to know about the internal affairs of the company;
- operational – ready for use at the right time and containing up-to-date data;
- useful for making management decisions.
Where can I get data for reporting? From accounting programs, financial documents, accounting reports. To begin with, of course, you need to establish a functional system for transmitting information at the enterprise.
For example, consumables have gone into production from a warehouse - the responsible persons (storekeeper and workshop manager) must document this matter.
In a large enterprise, it will be difficult to cover all aspects of production, so those responsible for drawing up the MA must act according to a pre-developed plan.
— “ Comrade Novoseltsev , is this your report? You need to deal with the matter seriously or not at all. Statistics is a science; it does not tolerate approximation. How can you use unverified data? Take it and remake it!”
From the film “Office Romance”
Novoseltsev with a report - a still from the film Office Romance
Now I will list the main tasks of the MA:
- providing management with reliable and up-to-date data regarding the financial and production activities of the company;
- forecast and analysis of the operation of the enterprise and its branches;
- increasing financial discipline;
- reduction of production costs;
- increased profits as a result of making economically feasible decisions.
The MA does not need to be sent to the Federal Tax Service or anywhere else. This is a document for internal use. It allows managers or owners to be aware of the objective situation at the enterprise. The document reflects the main processes that occur or occurred within the company during the reporting period.
Accounts receivable and payable report
The report on receivables and payables can be combined into one management document or divided into two independent documents. It allows you to assess the solvency of an enterprise and track debt turnover using relative ratios.
The very fact of the formation of receivables and payables is inevitable due to the temporary gap between payments and the transfer of finished products.
For your information
Accounts receivable are funds owed to the company by debtors; Accounts payable are funds that a company owes to its creditors.
A report on accounts receivable and payable is compiled as of a specific date, and the final recipient sees information about the status of settlements with counterparties and can quickly monitor the fulfillment of obligations.
An example of a management report on receivables and payables of an enterprise is in table. 9.
Table 9
Report on receivables and payables as of July 21, 2017
| No. | Debtors/ Creditors | Amount, rub. | Shipment | Payment made (advance payment) | Amount of debt as of July 21, 2017 | ||
| date | Amount, rub. | date | Amount, rub. | ||||
| 1 | Debtors | ||||||
| 1.1 | Beta LLC | 11 000 000,00 | 23.06.2017 | 11 000 000,00 | 16.06.2017 | 5 500 000,00 | 5 500 000,00 |
| 2 | Creditors | ||||||
| 2.1 | LLC "Norman" | 1 100 000,00 | 15.06.2017 | 1 100 000,00 | 09.06.2017 | 880 000,00 | 220 000,00 |
Analyzing the report data, the manager will see that on 06/09/2017 the company advanced 80% to Norman LLC (RUB 880,000.00). Products were shipped in full on June 15, 2017. But as of July 21, 2017, the company had not yet finally paid off its debt in the amount of RUB 220,000.00.
At the same time, Beta LLC made an advance (50%) in the amount of 5,500.00 thousand rubles, the products were shipped in full on June 23, 2017. But the company has not received the final payment of 50%.
As a rule, contracts with counterparties specify the terms of delivery and the time interval between delivery and final payment (for example, final payment is made within five working days from the date of acceptance of the delivered products by the buyer). For violation of payment deadlines, sanctions are expected (for example, a penalty in the amount of 0.1% of the amount of the delayed payment for each day of delay).
Therefore, in the event of claims from creditors, the company will be forced not only to make a final settlement, but also to pay penalties, and these are additional unforeseen costs.
Other management reports
Management report on the execution of the production plan
Contains planned and actual indicators. At the request of the final recipient, details are provided by workshop.
Ideally, these types of reports should be generated monthly. This will allow you to monitor the implementation of the annual production program and see the overall production picture.
Let us also draw attention to the fact that, as a rule, bonuses for production workers directly depend on the implementation of plans. Therefore, it is also possible to provide forms of an explanatory note in case of non-fulfillment of the production plan, which should be drawn up by shop managers or other authorized persons of the enterprise, making sure to indicate the reasons for the missed deadlines (for example, identification of additional faults, lack of necessary materials in the warehouse to complete production, etc.).
Management report on the execution of the marketing plan
The marketing plan (forecast of sales volumes), as a rule, is drawn up by the marketing department.
The report on the execution of the marketing plan reflects planned and actual indicators. Fluctuations of plan-actual values within 10% are considered acceptable. Otherwise, it is necessary to adjust the plan taking into account the identified deviations.
In addition, it is necessary to analyze the reasons for deviations. Perhaps a competitor has appeared on the market with lower prices, buyers are not able to purchase goods at the offered prices, etc.
A management report on the execution of the marketing plan allows you to “keep your finger on the pulse” regarding fluctuations in the external environment and quickly respond to changes:
- monitor the actions of competitors (including potential ones);
- increase or maintain the competitiveness of the enterprise;
- monitor the demand for products and the solvency of buyers.
Management report on work in progress
Work in progress (WIP) is products that have not completed the entire production cycle. The share of costs for work in progress in the total costs of an enterprise can be quite significant.
As a rule, the management report for work in progress is detailed - all costs included in the cost are indicated (material costs, labor costs, overhead costs, etc.), the percentage of work completed and the expenditure of funds according to the standard (for example, materials were spent in the amount of 1000.00 rubles ., and the standard for finished products is 2000.00 rubles, therefore, the percentage of expenditure is 50).
The report may also include data on the labor intensity of the work.
Report on stocks of raw materials and materials
Stocks of raw materials and supplies must ensure the uninterrupted production process.
Suppliers often offer discounts when purchasing large quantities of goods, raw materials, and components. But businesses should remember that the costs of maintaining and storing these inventory items may exceed the benefit received from the discount. At the same time, by purchasing large quantities, you can save on transportation costs.
As mentioned earlier, one of the reasons for failure to meet the production plan may be a lack of materials in the warehouse. Therefore, a report on inventories of raw materials and supplies must be generated in accordance with the production plan.
This report is usually generated by the supply structural divisions of the enterprise (materials and technical supply department, material support service, etc.).
When planning inventories of raw materials and supplies, it is necessary to take into account production plan data (usually annual) and standards for the consumption of raw materials and materials per unit of production. You should also provide an insurance stock of materials in case of changes in the external environment (increasing demand, increasing the delivery time of materials, increasing the cost of inventory, etc.).
The management report on inventories of raw materials and supplies should also reflect actual indicators linked to the production plan.
Finished goods inventory report
It is necessary to create stocks of finished products to ensure the uninterrupted production process. But even here there are pitfalls: an increase in inventories of finished products also increases the cost of storing them. And in the event of a decline in demand, these finished products may not be in demand at all. The situation will only get worse if the product is perishable and has a certain expiration date.
The enterprise should establish such an optimal volume of finished product inventories that will meet the needs of consumers.
The report includes planned and actual indicators. Sometimes managers require additional information - the planned volume of production and sales, so that all movements of finished products are presented in one management report.
In addition, similar to the report on inventories of raw materials and materials, here you also need to take into account the safety stock in case of defects in production, unforeseen and force majeure circumstances, as well as in case of deviations of the sales volume forecast from actual indicators.
Management reporting
Stages of formation and preparation of management reporting
- Diagnostics of the existing control system
- Creation of a management reporting methodology
- Design and approval of the company's financial structure
- Formation of a budget model
- Approval of budget policy
- Audit of accounting systems
- Automation
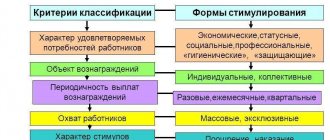
Important aspects when preparing management reporting: forms and examples. Management reporting is one of the most important sources of obtaining information about the company’s performance, based on a set of financial, sales, marketing, production and other indicators.
Information in management reporting should be economically interesting and actively used by managers, founders and business owners. The data disclosed in management reporting is necessary for the analysis of all activities. This helps to timely identify the reasons for possible deviations from the parameters set by the business strategy, as well as show reserves (financial, material, labor, etc.) that have not been used by the company until this time.
Below are 7 stages of formation and preparation of management reporting.
Step 1. Diagnostics of the existing management system in the company
This stage is necessary to analyze the organizational structure of the company; the format of process modeling is determined. If the company has business process diagrams and their descriptions, these documents are analyzed and the main problem areas that require optimization are identified.
| Diagnostic goals | Search for systematic approaches to increasing the efficiency of management reporting |
| Classification and analysis of existing reporting forms |
|
| Improving the quality and reducing the time required to obtain output analytical information necessary for making quality management decisions. | Analytical reports are of high value when they can be obtained in a short time and contain information in a form that best meets the needs of the employee who makes decisions based on this report. |
| Increasing the reliability of stored information. | To make decisions, you must rely only on reliable information. It is not always possible to understand how reliable the information presented in the reports is; Accordingly, the risk of making poor-quality decisions increases. On the other hand, if an employee does not bear official responsibility for the accuracy of the information entered, then with a very high degree of probability he will not treat the information with due care. |
| Increasing the analytical value of information. | A non-systematic approach to entering and storing information leads to the fact that, despite the fact that large amounts of information are entered into the database, it is almost impossible to present this information in the form of reports. Non-systematicity here means the input of information by employees without the development of general rules, which leads to a situation where the same information is presented to different employees in a different form from each other. |
| Elimination of inconsistency and inconsistency of information | If there is unclear clarity regarding the division of responsibilities and rights between employees to enter information, the same information is often entered multiple times in different departments of the company. In combination with a non-systematic approach, the fact of duplication of information may even be impossible to determine. Such duplication makes it impossible to obtain a complete report based on the entered information. |
| Increasing the predictability of obtaining a certain result | Decision making is almost always based on assessing information from past periods. But it often happens that the necessary information was simply never entered. In most cases, it would not be difficult to store missing information if someone assumed in advance that it would someday be needed. |
| Result | Based on the diagnostics and decisions made, job descriptions are finalized, existing business processes are reengineered, reporting forms that do not provide information for data analysis are eliminated, KPI indicators are introduced, accounting systems are adapted to obtain actual data, and the composition and timing of management reporting are fixed. |
Step 2. Creating a management reporting methodology
This stage is necessary for delegating authority in terms of drawing up operating budgets and determining the responsibility of specific financial responsibility centers (FRCs) for drawing up certain budget plans (segments of management reporting).
Figure 1. Sequence of stages in constructing a management reporting methodology.
Goals and objectives solved as a result of the implementation of management reporting in the company:
- Establishing and achieving specific key performance indicators (KPIs);
- Identification of “weak” links in the organizational structure of the company;
- Increasing the performance monitoring system;
- Ensuring transparency of cash flows;
- Strengthening payment discipline;
- Development of an employee motivation system;
- Prompt response to changes: market conditions, sales channels, etc.;
- Identification of the company's internal resources;
- Risk assessment, etc.
The composition of management reports depends primarily on the nature of the company's activities. As practice shows, the composition of management reporting (master report) usually includes:
- Cash flow statement (direct method);
- Cash flow statement (indirect method);
- Gains and losses report;
- Forecast balance (managerial balance);
Figure 2. Example of a management reporting structure.
Figure 3. Relationship between the classifier of management reports and management accounting objects.
Consolidation of budgets
The preparation of consolidated management reporting is a rather labor-intensive process. Consolidated financial management reporting considers a group of interrelated organizations as a single whole. Assets, liabilities, income and expenses are combined into a common management reporting system. Such reporting characterizes the property and financial position of the entire group of companies as of the reporting date, as well as the financial results of its activities for the reporting period. If the holding consists of companies that are not connected with each other at the operational level, then the task of consolidating management reporting is solved quite simply. If business transactions are carried out between the companies of the holding, then in this case not everything is so obvious, because it will be necessary to exclude mutual transactions so as not to distort the data on income and expenses, assets and liabilities at the holding level in the consolidated statements. The company's budget policy needs to consolidate the rules and principles for eliminating VGOs.
Therefore, it is more expedient to use information systems. For these purposes, you can use the “WA: Financier” system. The system allows you to eliminate intra-company turnover at the level of processing primary documents and quickly obtain correct information, which simplifies and speeds up the process of generating management reporting and minimizes errors associated with the human factor. At the same time, the reconciliation of intragroup turnover, their elimination, the execution of corrective entries and other operations are carried out automatically.
Example of management reporting: Company A owns company B 100%. Company A sold goods for the amount of 1,500 rubles. The purchase of this product cost company A 1000 rubles. Company B paid for the goods delivered in full. At the end of the reporting period, Company B did not sell the product and it is included in its reporting.
As a result of consolidation, it is necessary to eliminate the profit (500 rubles) that the company has not yet received and reduce the cost of inventories (500 rubles).
To exclude VGOs and profits that Company B has not yet earned. Adjustments need to be made.
Result of management reporting consolidation
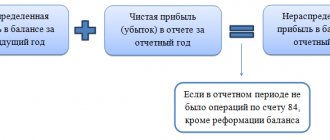
Figure 4. Forecast balance (managerial balance).
Determination of key performance indicators (KPI – Key performance indicators)
The introduction of key control indicators allows you to manage financial responsibility centers by setting limits, standard values or maximum boundaries of accepted indicators. The set of performance indicators for individual central financial districts significantly depends on the role of this center of responsibility in the management system and on the functions performed. The indicator values are set taking into account the company’s strategic plans and the development of individual business areas. The system of indicators can take on a hierarchical structure, both for the company as a whole, and with detail down to each center of financial responsibility. After detailing the top-level KPIs and transferring them to the levels of the Central Federal District and employees, staff remuneration, etc. can be linked to them.
Figure 5. Example of using key company indicators.
Control and analysis of management reporting and execution
For the execution of budgets included in management reporting, three areas of control can be distinguished:
- preliminary;
- current (operational);
- final.
The purpose of preliminary control is to prevent potential budget violations, in other words, to prevent unreasonable expenses. It is carried out before business transactions are carried out. The most common form of such control is the approval of requests (for example, for payment or shipment of goods from a warehouse).
Current control over budget execution involves regular monitoring of the activities of financial responsibility centers to identify deviations in the actual performance indicators from those planned. Conducted daily or weekly based on operational reporting.
Final control of budget execution is nothing more than an analysis of the implementation of plans after the close of the period, an assessment of the financial and economic activities of the company as a whole and for management accounting objects.
In the process of executing budgets, it is important to identify deviations at the earliest stages. Determine what methods of preliminary and current budget control can be used in the company. For example, introduce procedures for approving requests for payment or release of materials from the warehouse. This will allow you to avoid unnecessary expenses, prevent budget failure and take action in advance. Be sure to regulate control procedures. Create a separate budget control regulation. Describe in it the types and stages of inspections, their frequency, the procedure for revising budgets, key indicators and ranges of their deviations. This will make the control process transparent and understandable, and will increase executive discipline in the company.
Figure 6. Monitoring the implementation of planned indicators of management reporting.
Step 3. Design and approval of the company's financial structure
This stage includes work on the formation of classifiers of budgets and budget items, the development of a set of operating budgets, planning items and their relationships with each other, and the imposition of types of budgets on the organizational units of the company’s management structure.
Based on the organizational structure of the company, a financial structure is developed. As part of this work, financial responsibility centers (FRCs) are formed from organizational units (divisions) and a model of the financial structure is built. The main task of building the financial structure of an enterprise is to get an answer to the question of who should draw up what budgets in the enterprise. A correctly constructed financial structure of an enterprise allows you to see the “key points” at which profits will be formed, taken into account and, most likely, redistributed, as well as control over the company’s expenses and income.
The Financial Responsibility Center (FRC) is an object of the company’s financial structure that is responsible for all financial results: revenue, profit (loss), costs. The ultimate goal of any central financial institution is to maximize profits. For each central financial district, all three main budgets are drawn up: a budget of income and expenses, a cash flow budget and a forecast balance (managerial balance sheet). As a rule, individual organizations act as central financial districts; subsidiaries of holdings; separate divisions, representative offices and branches of large companies; regionally or technologically isolated types of activities (businesses) of multi-industry companies.
Financial accounting center (FAC) is an object of the company’s financial structure that is responsible only for some financial indicators, for example, income and part of the costs. For the DFS, a budget of income and expenses or some private and functional budgets (labor budget, sales budget) are drawn up. The DFS can be the main production workshops participating in unified technological chains at enterprises with a sequential or continuous technological cycle; production (assembly) shops; sales services and divisions. Financial accounting centers may have a narrow focus:
- marginal profit center (profit center) - a structural unit or group of units whose activities are directly related to the implementation of one or more business projects of the company that ensure the receipt and accounting of profit;
- income center - a structural unit or group of units whose activities are aimed at generating income and do not include profit accounting (for example, a sales service);
- investment center (venture center) - a structural unit or group of units that are directly related to the organization of new business projects, profits from which are expected in the future.
- cost center is an object of the financial structure of an enterprise that is responsible only for expenses . And not for all expenses, but for the so-called regulated expenses, the expenditure and savings of which the management of the Central Bank can control. These are departments that serve the main business processes. Only some auxiliary budgets are drawn up for central planning. The auxiliary services of the enterprise (housekeeping department, security service, administration) can act as a central protection center. A cost center may also be referred to as center (cost center) .
Figure 7. Design of the company's financial structure.
Step 4. Formation of a budget model
There are no strict requirements for the development of a classifier of internal management reporting. Just as no two companies are exactly alike, no two budget structures are exactly alike. Unlike formalized financial statements: a profit and loss statement or a balance sheet, management reporting does not have a standardized form that must be strictly followed. The structure of internal management reporting depends on the specifics of the company, the budget policy adopted by the company, the wishes of management regarding the level of detail of articles for analysis, etc. We can only give general recommendations on how to draw up the optimal structure of management reporting.
The structure of management reporting should correspond to the structure of the company's daily activities. See also “Classification of costs in management accounting”
Figure 8. Scheme of interaction of budget forms using the example of the simplest budget model.
Classification of items using the example of a Cash Flow Statement
Figure 9. Execution of the cash flow budget (CF (BDDS)).
Step 5. Approval of budget policy and development of regulations
Budget policy is formed with the aim of developing and consolidating the principles for the formation and consolidation of indicators for these items and methods for their assessment. This includes: determination of the time period, planning procedures, budget formats, action program of each of the participants in the process. After developing the budget model, it is necessary to move on to regulating the budget process.
It is necessary to determine which budgets are formed in the company and in what sequence. For each budget, it is necessary to identify a person responsible for preparation (a specific employee, a central federal district) and someone responsible for the execution of the budget (the head of a department, a head of a central federal district), and set limits, standard values or maximum boundaries for the performance indicators of a central federal district. It is imperative to form a budget committee - this is a body created for the purpose of managing the budget process, monitoring its execution and making decisions.
The next step is to transfer the planning, execution and completion phases to the schedule. The formed plan - schedule will be the budgeting regulations for the enterprise.
Figure 10. Enterprise budgeting planning phases.
Step 6. Audit of accounting systems
At the stage of development and approval of the composition of the company’s management reporting, it is also necessary to take into account that the classifier of budget items must be sufficiently detailed to provide you with useful information about the company’s income and expenses. At the same time, you need to understand that the more levels of detail are allocated, the more time and labor costs will be required to compile management reporting, budgets and reports, but the more detailed analytics can be obtained.
It is also necessary to take into account that as a result of developing a management reporting methodology, adaptation of accounting systems may be required, because To analyze budget execution, planned indicators will have to be compared with available actual information.
Videos of past webinars on the topic “Management Accounting / IFRS”
Look
Step 7. Automation
This stage includes work on selecting a software product, creating technical specifications, implementation and maintenance of the system.
Date of last update: 08/25/2016 16:07
See also “Responsibilities of a financial manager”